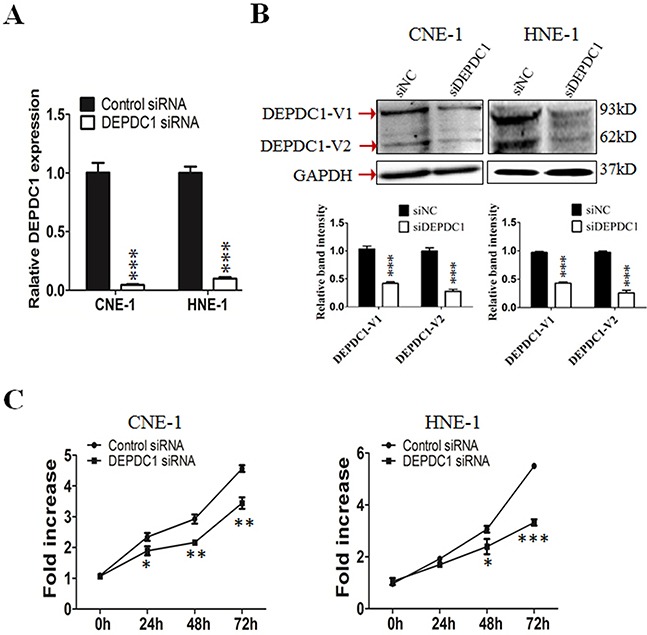
Figure 2. DEPDC1 knockdown inhibits NPC cells proliferation.

(A & B) siRNA-mediated DEPDC1 depletion. CNE-1 and HNE-1 cells were transiently transfected with the control siRNA and DEPDC1 siRNA, respectively. Fourty-eight hours after transfection, total RNA and whole cell lysates were prepared. The expression of DEPDC1 was determined at both mRNA and protein levels by qRT-PCR (A) and immunoblotting (B), respectively. Optical densities (O.D.) of individual bands on immunoblots were quantified. Data are expressed as the ratio of the DEPDC1 : GAPDH optical densities in DEPDC1 siRNA group relative to that in NC siRNA group and are representative of three separate experiments (mean ± S.D.). GAPDH was use as an internal control (P*** < 0.001, Student's t-test). (C) DEPDC1 depletion inhibits NPC cell proliferation. Immediately after siRNA transfection, cell proliferation was measured at the indicated time points by CCK-8 assay in CNE-1 and HNE-1 cells, respectively. The y-axis represents the average fold increase in cell numbers. The error bars represent the standard errors of three independent experiments (P* < 0.05 P** < 0.01 P*** < 0.001, Student's t-test).
