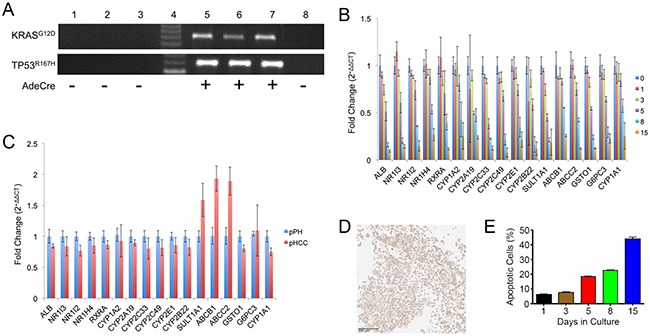
Figure 1. Hepatocyte gene expression and survival in culture.

(A) Agarose gel electrophoresis of RT-PCR products for transgenes (TP53R167H and KRASG12D). Lane 1, pPH1 cell line; Lane 2, pPH2 cell line; Lane 3, pPH3 cell line; Lane 4, Molecular weight markers; Lane 5, pHCC1 cell line; Lane 6, pHCC2 cell line; Lane 7, pHCC3 cell line; Lane 8, Oncopig fibroblasts (negative control). (B) Expression of drug metabolism enzyme, nuclear receptor, and hepatocyte functional genes in pPH cells over time as assessed by qPCR. Numbers represent days in culture. (C) Relative expression of pHCC cells (passage 8) cultured in the presence of DMSO compared to pPH cells after 1 day of culturing as assessed by qPCR. (D) Positive Hep Par-1 staining of cultured pHCC cells (scale bar 200 μm). (E) Proportion of pPH cells positive for Annexin-V staining (apoptotic) detected by Flow Cytometry. Bar graphs indicate the average across the cell lines, with error bars representing the standard deviation.
