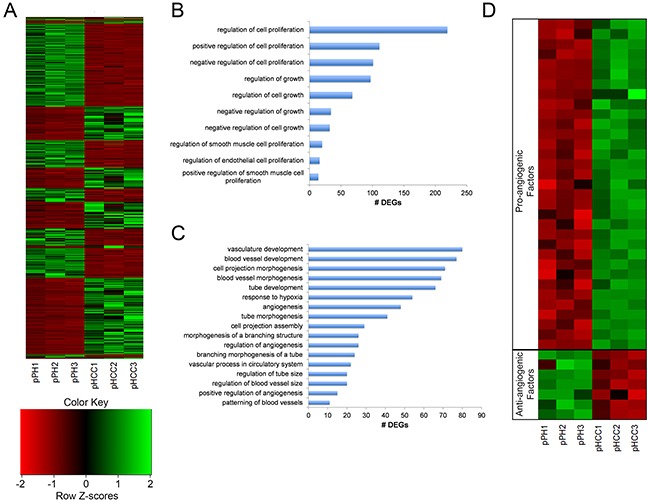
Figure 5. pHCC cell line expression related to cell cycle progression and angiogenesis.

(A) Heat map of normalized expression levels of 3,481 differentially expressed genes (DEGs) for individual cell lines, represented as z-scores. (B) Enriched gene ontology (GO) terms associated with regulation of cell growth and proliferation. (C) Enriched GO terms associated with regulation of angiogenesis. (D) Heatmap of pro- and anti-angiogenic factors displaying elevated and reduced expression in pHCC cell lines, respectively, represented as z-scores.
