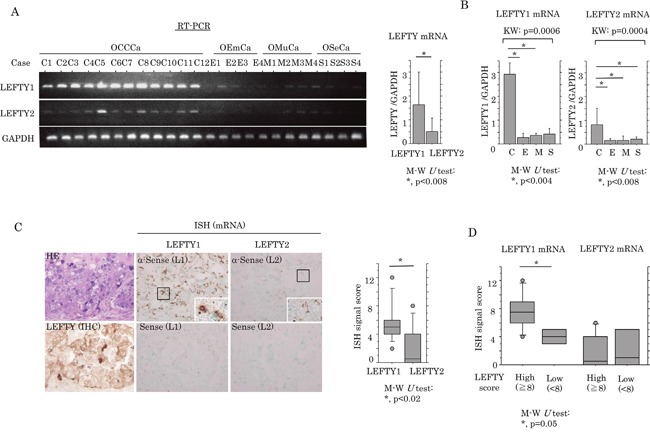
Figure 2. Up-regulation of LEFTY mRNA expression in OCCCa.

(A) Left: expression of LEFTY1 and LEFTY2 mRNA in OECa by RT-PCR assay. Note the frequent mRNA expression of LEFTY1, but not LEFTY2, in OCCCa, in contrast to its low or absent expression level in non-OCCCa. OCCCa, clear cell carcinoma; OEmCa, endometrioid carcinoma; OMuCa, mucinous carcinoma; OSeCa, serous carcinoma. Right: relative LEFTY1 and LEFTY2 mRNA levels in OECas were calculated by normalization to GAPDH using an NIH ImageJ program. Data was expressed as mean±SD. (B) Relative mRNA levels of LEFTY1 (left) and LEFTY2 (right) in OECas were calculated by normalization to GAPDH using an NIH ImageJ program. C, OCCCa; E, OEmCa; M, OMuCa; S, OSeCa; KW, Kruskal-Wallis; M-W, Mann-Whitney U-test. Data was expressed as mean±SD. (C) Left: staining by HE, IHC for LEFTY, and in situ hybridization (ISH) for mRNA of LEFTY1 (L1) and LEFTY2 (L2) in OCCCa. Enclosed boxes are magnified. Original magnification, x200 and x400 (inset). Right: ISH signal score for LEFTY1 and LEFTY2 in OCCCa. M-W, Mann-Whitney U-test. (D) Relationship of ISH signals for LEFTY1 and LEFTY2 mRNAs with an IHC score for LEFTY. M-W, Mann-Whitney U-test.
