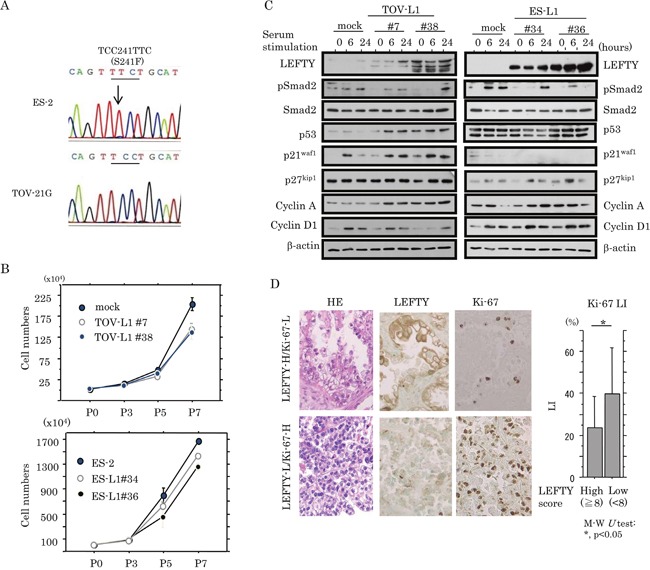
Figure 4. Association between overexpression of LEFTY and cell proliferation in OCCCa.

(A) Sequence analysis of p53. Note the heterozygous substitution mutation (indicated by an arrow) in ES-2, but not TOV-21G, cells. (B) Two independent TOV-21G (TOV-L1#7 and #38) and ES-2 (ES-L1#34 and #36) cell lines stably overexpressing LEFTY1 and their mock cells were seeded at low density. The cell numbers are presented as mean±SD. P0, P3, P5, and P7 indicate 0, 3, 5, and 7 days after cell passage, respectively. (C) Western blot analysis for the indicated proteins in both TOV-L1 and ES-L1 stable cells and their mock cells for the times shown following restimulation with 10% serum after serum starvation for 6 h. (D) Left: HE staining and IHC for LEFTY, and Ki-67 in OCCCa. Sporadic Ki-67-immunopositive cells are shown in OCCCa with high LEFTY immunoreactivity, in contrast to the diffuse Ki-67 staining in tumors with low LEFTY staining. Original magnification, x200. Right: Ki-67 labeling indices (LIs) between OCCCas with high and low LEFTY scores. Data are expressed as the mean±SD. M-W, Mann-Whitney U-test.
