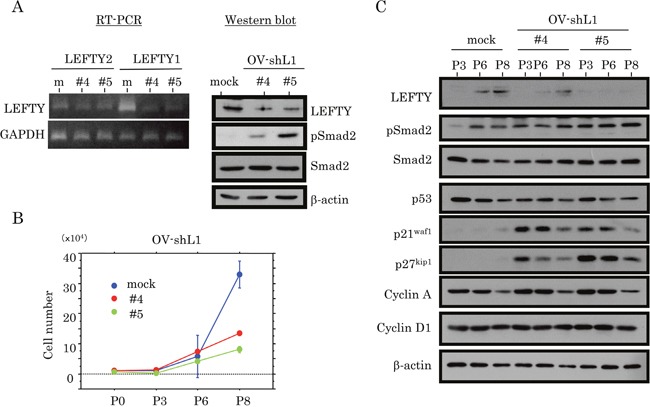
Figure 5. Association between knockdown of LEFTY expression and cell proliferation in OCCCa.

(A) Decreased expression of endogenous LEFTY at both mRNA (left, RT-PCR) and protein (right, western blot) levels in two independent OVISE cell lines with knockdown of endogenous LEFTY1 expression (OV-shL1#4 and #5). (B) Two independent OV-shL1#4 and #5 cells and the mock cells were seeded at low density. The cell numbers are presented as mean±SD. P0, P3, P6, and P8 indicate 0, 3, 6, and 8 days after cell passage, respectively. (C) Western blot analysis for the indicated proteins in OV-shL1 and mock cells for the times shown.
