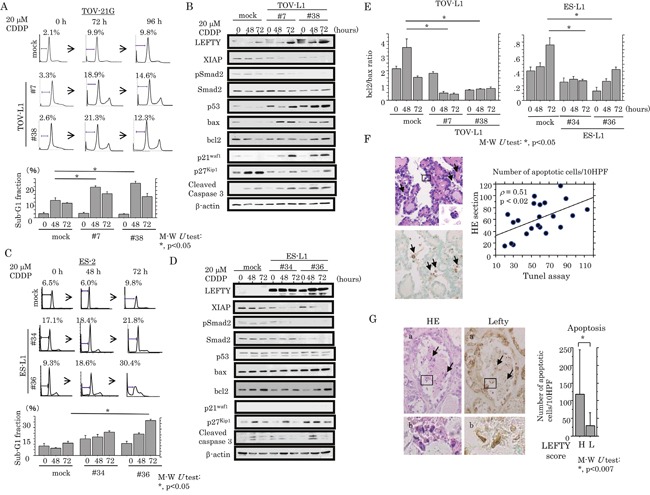
Figure 6. Association between overexpression of LEFTY and susceptibility to apoptosis in OCCCa.

(A) After treatment of TOV-L1 and the mock cells with 20 μM CDDP for the times indicated, cells undergoing apoptosis (sub-G1) were detected by flow cytometry (upper) and as the percentage sub-G1 fraction (lower). This experiment was performed in triplicate using independent samples. (B) Western blot analysis of the indicated proteins from TOV-L1 stable cells and the mock cells after 20 μM CDDP treatment for the times shown. (C) After treatment of ES-L1 stable cells and the mock cells with 20 μM CDDP for the times indicated, cells undergoing apoptosis (sub-G1) were detected by flow cytometry (upper) and the percentage sub-G1 fraction following CDDP treatment (lower). This experiment was performed in triplicate using independent samples. (D) Western blot analysis for the indicated proteins from ES-L1 stable cells and the mock cells after 20 μM CDDP treatment for the times shown. (E) Values of endogenous bcl2 relative to bax protein were calculated by normalization to β-actin in TOV-L1 (left) and ES-L1 (right) stable cells after 20 μM CDDP treatment for the times shown. M-W, Mann-Whitney U-test. (F) Left: detection of apoptotic cells (boxes enclose magnified apoptotic cells) by HE staining (upper) and TUNEL assay (lower) in OCCCa. Note the TUNEL-positive apoptotic cells (indicated by arrows). Original magnification, x100 and x400 (inset). Right: correlation of the detection of apoptotic cells between HE sections and TUNEL assay. (G) Left: staining is by HE and IHC for LEFTY in OCCCa. Of note, some apoptotic cells have LEFTY immunoreactivity (indicated by arrows). Enclosed boxes in panels (a) are magnified in panels (b). Original magnification, x100 and x400 (inset). Right: apoptotic cells detected by HE sections in OCCCa with high and low LEFTY scores. M-W, Mann-Whitney U-test.
