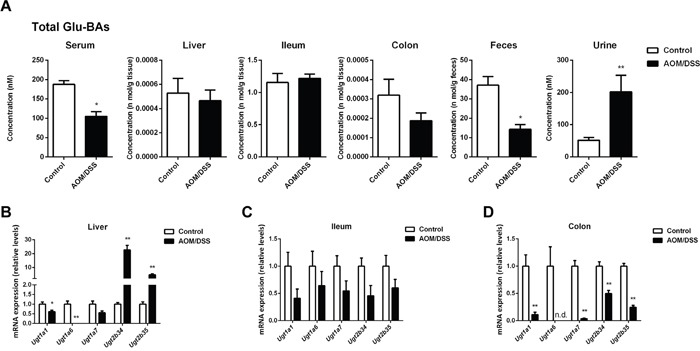
Figure 6. CAC mice showed dysregulated glucuronidation of BAs.

(A) Total concentration of glucuronide-conjugated BAs in individual compartments, including serum, liver, ileum, colon, feces and urine. (B-D) The mRNA expression of Ugts in liver, ileum and colon. Data are represented as mean ± S.E.M. of six mice. *P<0.05, **P<0.01 versus normal control, Student's t-test.
