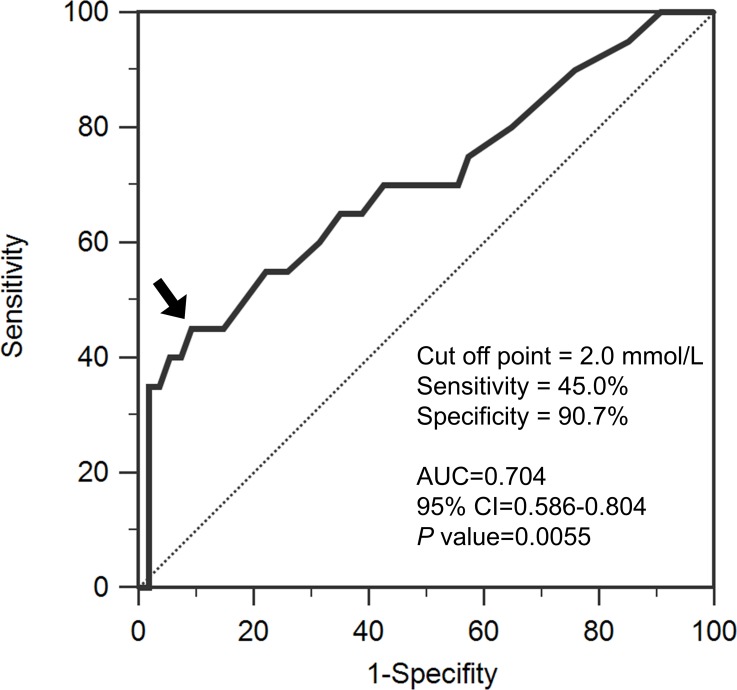
Figure 1. Receiver operating characteristic analysis of serum lactate levels for differentiating between high-grade and low-grade brain tumors.
The area under the curve (AUC) is 0.705 (95% confidence interval [CI], 0.586–0.804). The arrow indicates the optimal cutoff value for lactate (2.0 mmol/L). The dotted line is the no-discrimination curve.

