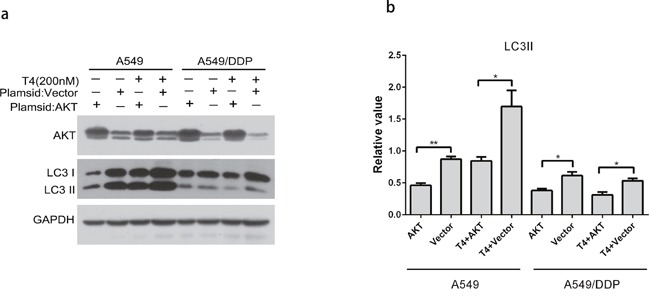
Figure 5. Changes in LC3 in A549 and A549/DDP cells following the OE-AKT+T4 treatment.

(a and b) LC3II increased when AKT was overexpressed, which was reversed by the T4 treatment (*: P<0.05, **: P<0.01).

(a and b) LC3II increased when AKT was overexpressed, which was reversed by the T4 treatment (*: P<0.05, **: P<0.01).