
Figure 2.
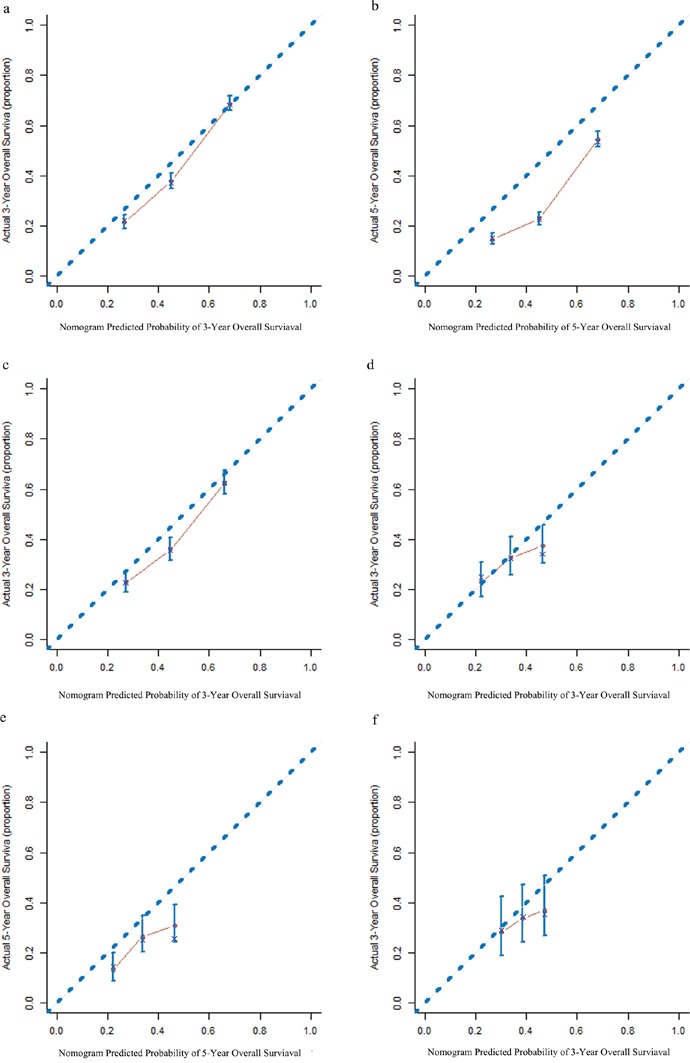
The calibration curves for predicting survival of patients with non-small-cell lung cancer at (a) 3 years and (b) 5 years in the primary cohort, and at (c) 3 years in the validation cohort; and for predicting survival of patients with small-cell lung cancer at (d) 3 years and (e) at 5 years in the primary cohort, and at (f) 3 years s in the validation cohort. The nomogram-predicted probability of the overall survival (OS) is plotted on the x-axis. The actual OS is plotted on the y-axis.