
Figure 2. NK cells are more active in BPTF depleted tumor microenvironments.
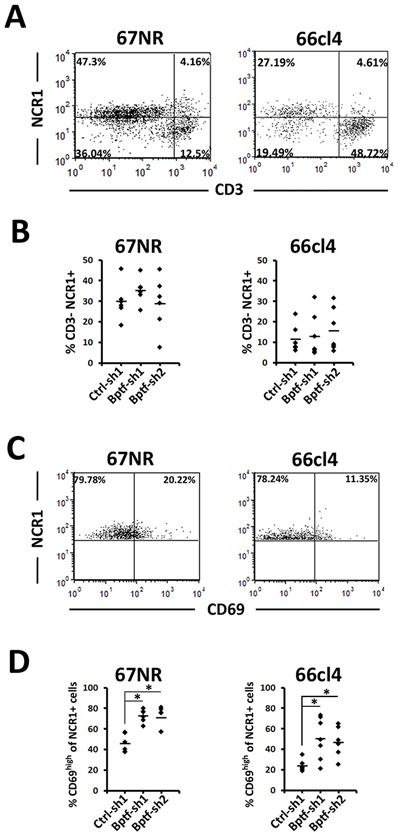
(A) Representative flow cytometry dot plots of live tumor infiltrating NK cells stained with CD3ε and NCR1. (B) Percentages of live CD3ε-, NCR1+ NK cells from A (n ≥ 6 biological replicates). (C) Representative flow cytometry dot plots of live tumor infiltrating NK cells stained with CD69 and NCR1. CD69high is defined by CD69 staining of live CD3ε- NCR1+ cells from the spleen. (D) Percentages of live NCR1+ cells that are CD69high (n = 6 biological replicates, * = ttest pvalue < 0.006). Quantitative data shown represent mean ± stdev.