
Figure 4. NK cell cytolytic activity to BPTF KD cells requires NCRs.
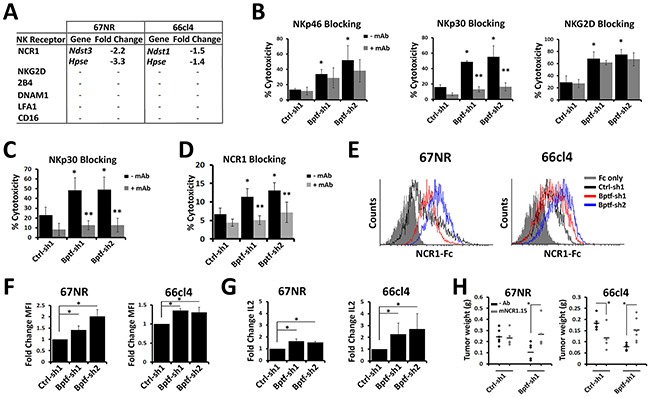
(A) Changes in NK receptor ligand expression measured by microarray in BPTF KD tumors harvested from NSG mice compared to controls. Hpse was measured independently by qRT-PCR because it was not on the microarray (* = ttest pvalue < 0.00002). (B-D) Percent target cell cytolytic activity by LDH assay. (B) NK-92 cells pretreated with anti-NKp46, anti-NKp30 or anti-NKG2D mAb were cocultured on 66cl4 targets at a 10:1 E:T ratio (n = 3 biological replicates, * = ttest pvalue < 0.05). (C) NK-92 cells pretreated with anti-NKp30 were cocultured with T47D targets at a 10:1 E:T ration (n = 3 biological replicates, * = ttest pvalue < 0.05). (D) Mouse NK cells pretreated with anti-NCR1 blocking mAb (clone mNCR1.15) were cocultured with 66cl4 targets at a 5:1 E:T ratio (n = 3 biological replicates, * = ttest pvalue < 0.04). (* = significant to no mAb Ctrl-sh1, ** = significant to the respective no mAb hairpin). (E) Representative flow cytometry histograms of NCR1-Ig binding to 67NR and 66cl4. (F) Fold change of MFI from D (n = 3 biological replicates, * = ttest pvalue < 0.03). (G) qRT-PCR analysis of Il-2 expression in Ncr1-ζ, Il-2 reporter BW cells incubated with control or BPTF KD cells for 48 hrs (n ≥ 3 biological replicates, * = ttest pvalue < 0.05). (H) 67NR and 66cl4 tumor weights harvested from untreated or mNCR1.15 treated BALB/c mice (n ≥ 4 biological replicates, * = ttest pvalue < 0.05). All quantitative data shown represent mean ± stdev.