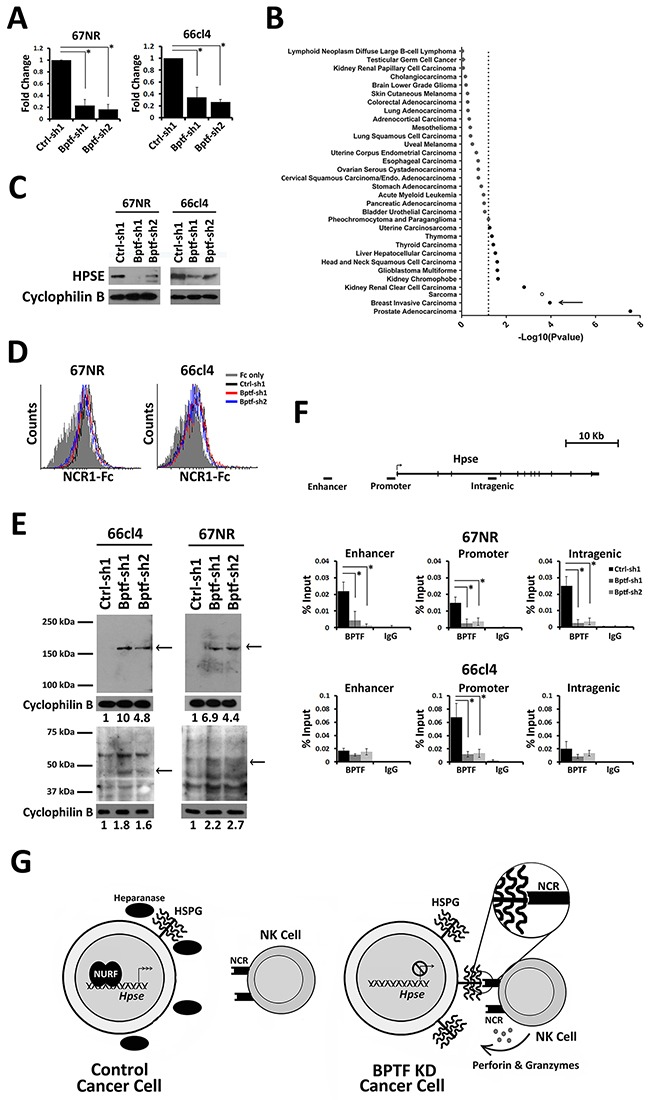
Figure 5. BPTF regulates Hpse expression.

(A) qRT-PCR analysis of Hpse expression from 67NR and 66cl4 cells (n = 3 biological replicates, * = ttest pvalue < 0.006). (B) Differential Hpse expression in BPTF high and BPTF low expression groups from TCGA datasets. The negative base 10 log of the p-value for each t-test is shown. Dashed line: significance cutoff pvalue = 0.05. Filled circles: positive correlation. Outlined circles: negative correlation. Breast cancer data set is shown with arrow. (C) Western blot analysis of cell surface HPSE from control and BPTF KD 67NR and 66cl4 cells. Cyclophilin B was used as a normalization control. (D) Representative flow cytometry histogram of NCR1-Ig binding to bacterial heparinase treated tumor cells. (E) Western blot analysis of cell surface HSPG using anti-HS primary mAb. Cyclophilin B was used as a normalization control. Arrows: reproducible changes in HSPG abundance with BPTF KD. ImageJ relative quantitation to controls are shown as numbers below blots. (F) BPTF ChIP at mouse Hpse in control and BPTF KD 67NR and 66cl4 cell lines (n = 3 biological replicates, * = ttest pvalue < 0.04). (G) A Model: In tumor cells NURF stimulates Hpse expression, and as a result cell surface heparanase abundance. Increased heparanase abundance reduces cell surface HSPGs and NCR HS co-ligand abundance, inhibiting NK-cell antitumor activity. When NURF is depleted, Hpse expression and heparanase is reduced. Reduced heparanase abundance increases cell surface HSPGs and NCR HS co-ligands, improving NK cell-mediated antitumor activity. All quantitative data shown represent mean ± stdev.
