
Figure 6. BPTF is required for an immune suppressive tumor microenvironment.
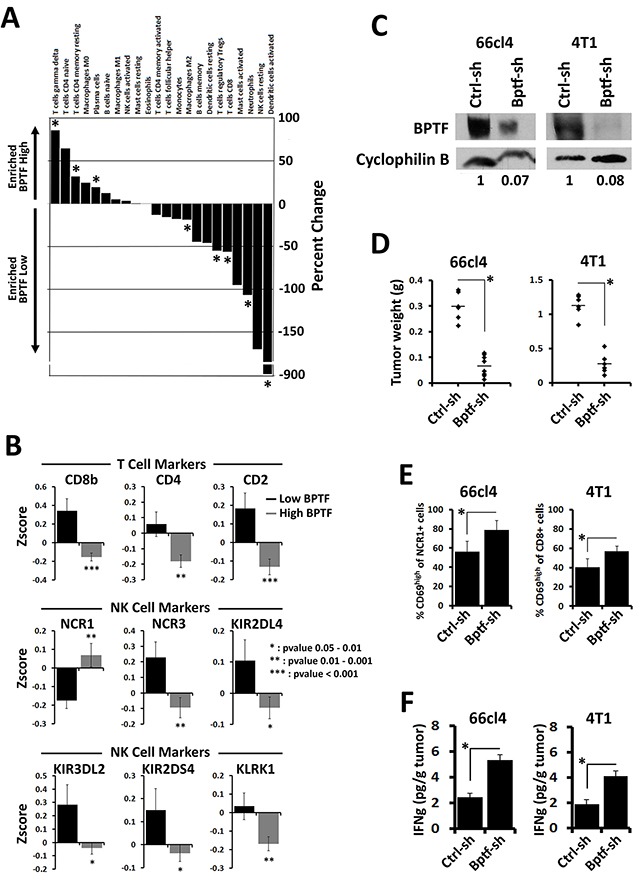
(A) Differential immune profiles identified using CIBERSORT between BPTF high and BPTF low expression groups from microarray expression profiles (* = ttest pvalue < 0.1). (B) Differential expression of immune cell markers in BPTF high and BPTF low expression groups from Zscore normalized expression data from breast cancer TCGA datasets (pvalues are shown in panel). (C) BPTF Western blot analysis of 66cl4 and 4T1 tumors injected with rAd expressing either control or BPTF KD shRNAs. Cyclophilin B was used as a loading control. ImageJ relative quantitation to controls are shown as numbers below blots. (D) Weights of 66cl4 and 4T1 tumors after treatment with rAd (n ≥ 6 biological replicates, * = ttest pvalue < 0.000003). (E) Flow cytometry analysis of 66cl4 tumor infiltrating NK cells and 4T1 tumor infiltrating CD8+ T cells. Active lymphocytes are quantified as percent CD69high of total infiltrating NK cells (NCR1+) or CD8+ T cells (CD8+) (n ≥ 4 biological replicates, * = ttest pvalue < 0.01). (F) IFNγ concentrations from 66cl4 and 4T1 tumor extracts measured by ELISA (n ≥ 6 biological replicates, * = ttest pvalue < 0.04). All quantitative data shown represent mean ± stdev.