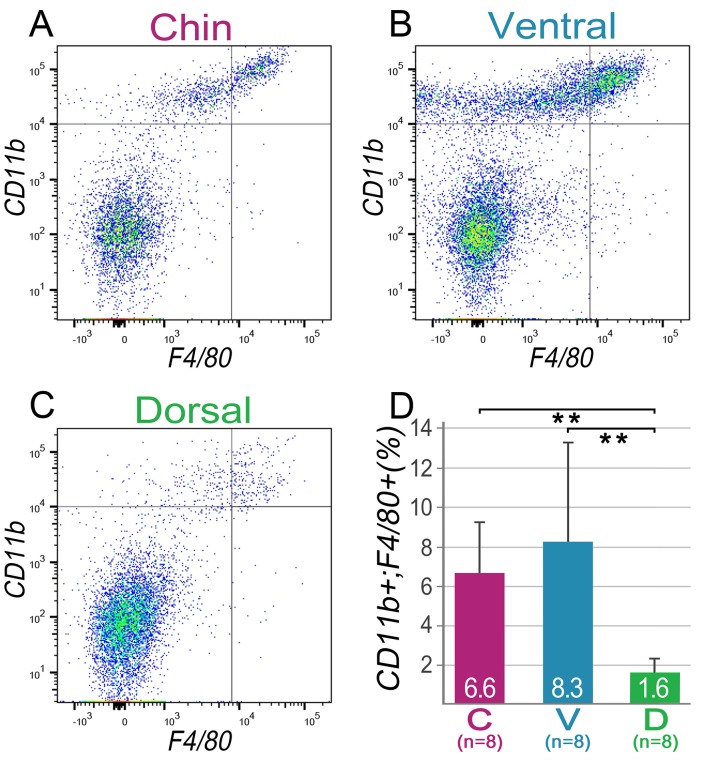
Appendix 1—figure 21. Domain-specific differences in macrophage abundance.
FACS analysis on early telogen skin reveals that chin and ventral domains contain significantly more CD11b+;F4/80+ macrophages as compared to dorsal domain. Example FACS plots are shown on A–C. Statistical analysis is shown on D and domain-specific data is color-coded as follows: chin (purple), ventral (blue) and domains (green). Average percentage of macrophages is indicated within each bar (** p<0.01).

