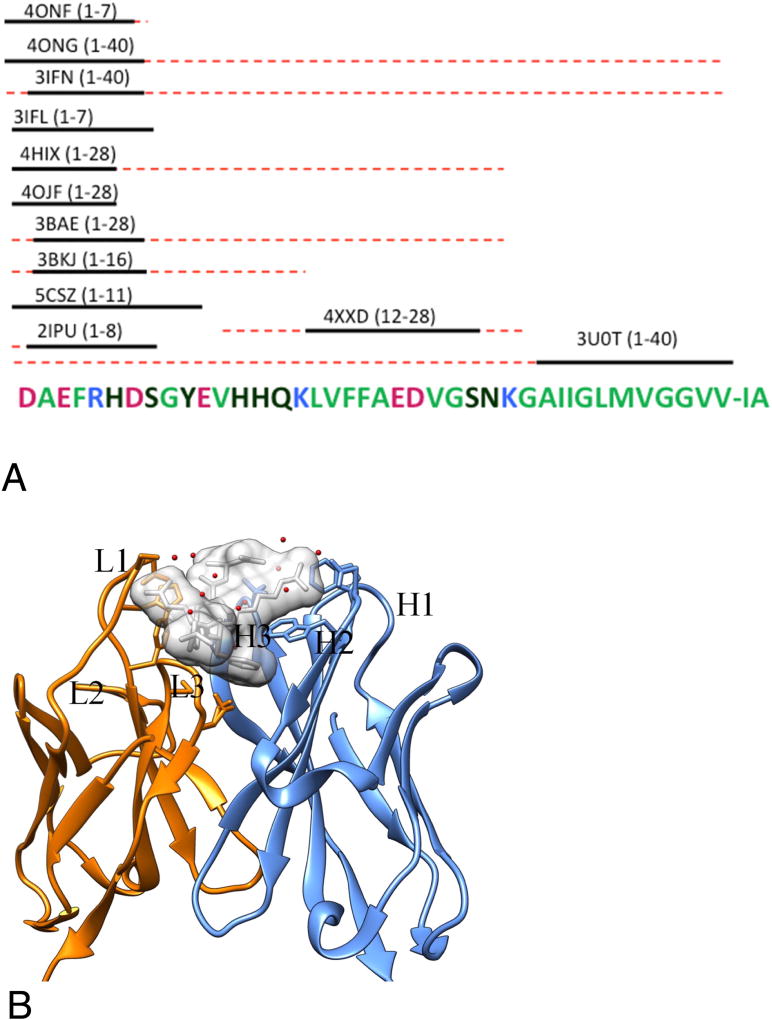
Figure 1.
Overview of antibody-Aβ peptide complex structures. (A) The solid lines represent residues with visible electron density. The red dashed lines indicate the sequence range included in the complex structure. Each antibody-antigen complex is labeled by their PDB code and the Aβ sequence is in parenthesis. (B) The complex structure (pdb ID: 3IFN) of amyloid peptides (Aβ2–7) and antibody (12A11 Fabs) [40]. The heavy chain and light chain of 12A11 Fabs is colored in cyan and orange and the potential paratope is shown in stick model. The Aβ2–7 is shown in white surface model to represent its occupation in3D space and also stick model to represent the epitope. Water molecules associated with the antigen-antibody binding are shown in red dots.

