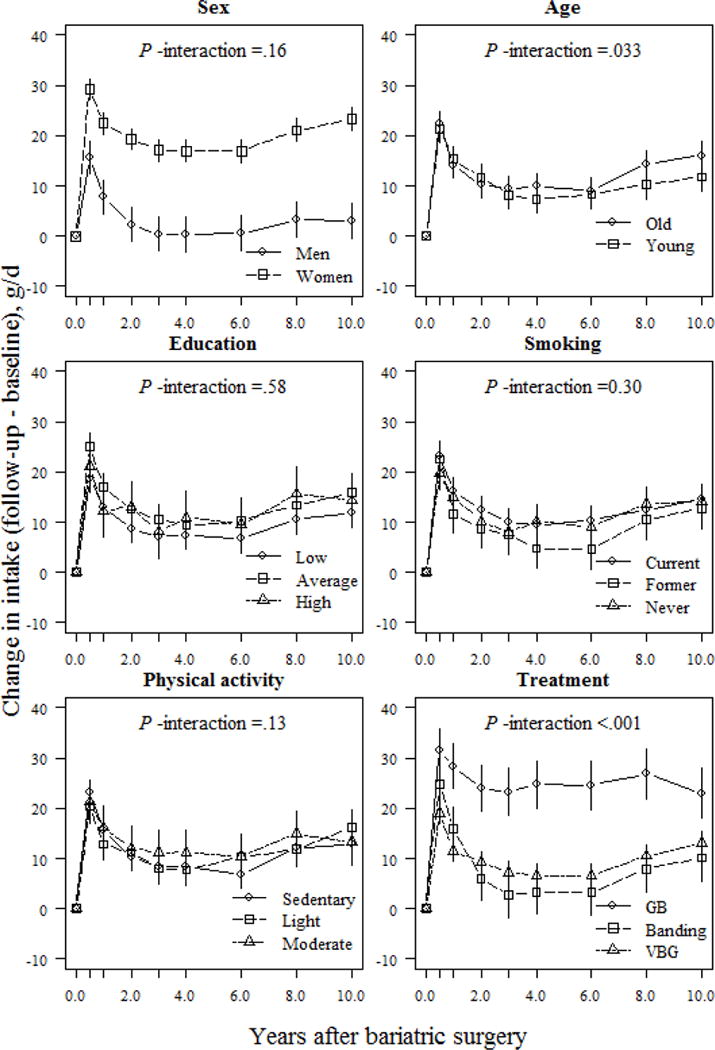
Fig 5.

Relative changes (means and 95% CIs) in fiber intake (E%) based on a mixed model for surgically treated individuals, grouped according to baseline sex, age, education, smoking and physical activity, and treatment type. The model was adjusted for sex and baseline age (except when examined as the main predictor) and baseline fiber intake. P-values for the interactions between subgroups and changes in fiber intake over time were derived from ANOVA tables (F-statistics). E% denotes percentage of total energy intake; GB, gastric bypass; VBG, vertical banded gastroplasty.
