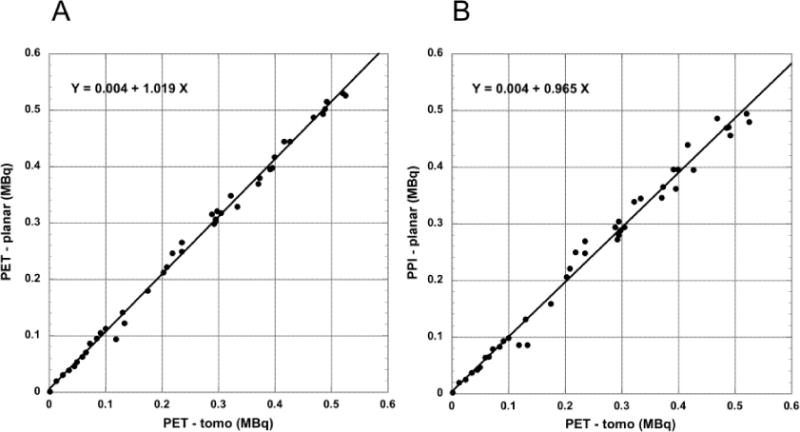
Figure 4.

(A) Total tumor radioactivity determined from a single ROI defined in the coronal PET tomographic volume (planar) projection image and (B) from the single ROI defined in the PPI planar image compared to total radioactivity determined by slice-by-slice analysis of the coronal PET tomographic images (N = 42). Plots include points indicated by arrows in Figure 3.
