Figure 3.

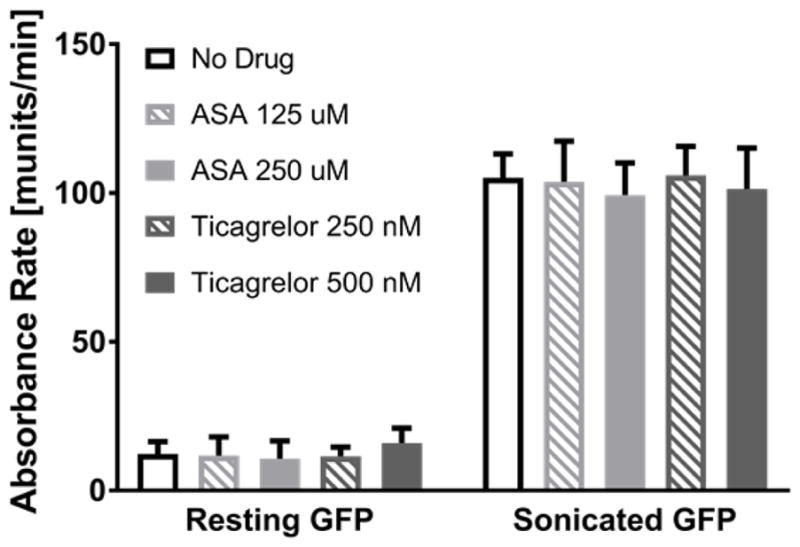
Results of the PAS assay for non stimulated (resting) and sonicated GFP in the absence and presence of ASA and ticagrelor at two different concentrations. Data are shown as mean ± standard deviation.

Results of the PAS assay for non stimulated (resting) and sonicated GFP in the absence and presence of ASA and ticagrelor at two different concentrations. Data are shown as mean ± standard deviation.