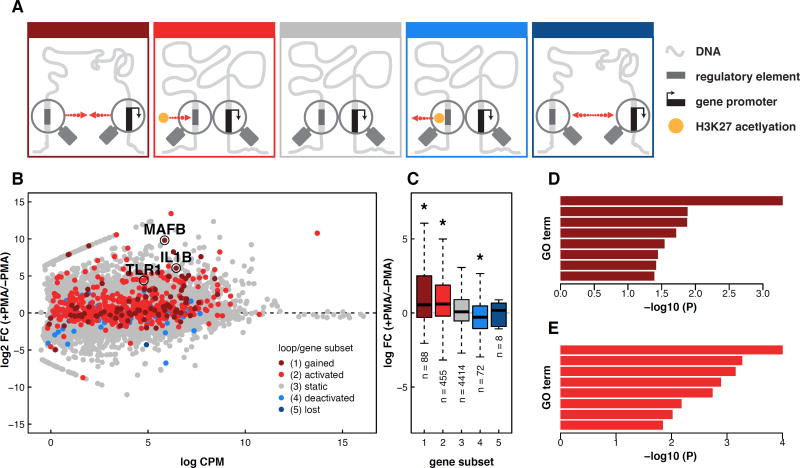
Figure 3. Expression and function of genes correlate with dynamic loop type and distal chromatin state.
(A) Schematic depictions of five loop classes. Red arrows indicate direction of change during PMA-induced differentiation of THP-1 cells. ‘Ac’ refers to a change in H3K27ac as detected by ChIP-seq. (B) Counts per million vs log fold change for all transcripts measured by RNA-seq. Genes are colored according to the class of loop found at their promoter. (C) RNA FPKM values for each gene subset. Selected GO terms enriched in genes sets at gained (D) and activated (E) loop anchors.

