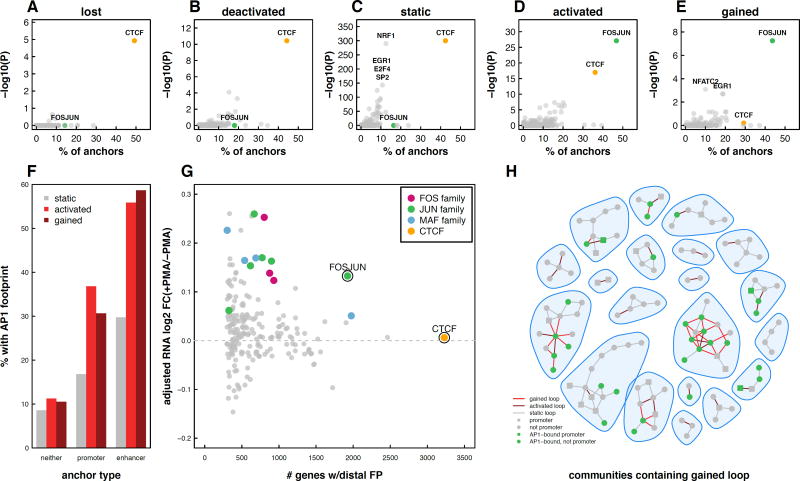
Figure 5. AP-1 enriched at enhancers containing loop anchors in both gained and activated loops.
Scatter plots depicting the percent of lost (A), deactivated (B), static (C), activated (D), and gained (E) anchors that overlap TF footprints and the −log 10 p-value of enrichment (Fisher’s Exact Test) for each TF. (F) Percent of loop anchors that overlap an AP-1 footprint as a function of loop subset and promoter or enhancer overlap (G) RNA fold-change of genes connected via a loop to distal TF footprints. FOS, JUN, and MAF points represent individual FOS-, JUN-, and MAF-related TF footprints. Log2 fold-changes were median normalized to account for the fact that genes at loop anchors exhibited a shift towards upregulation during differentiation. (H) 20 randomly chosen interaction communities containing a gained loop are shown. Loop anchors containing AP-1 footprints are indicated in green. See also Figure S5.

