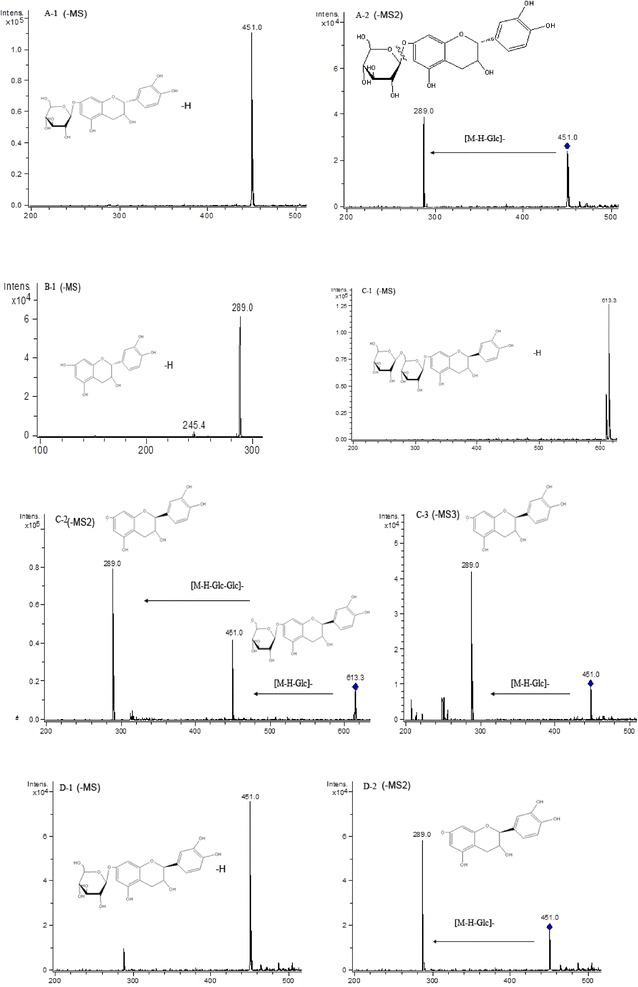
Fig. 5.

ESI (−) MS, MS2, and MS3 spectra of identified flavonoids in adzuki bean. Peak 1 (A): A-1 MS spectrum of peak 1 ([M−H]−), A-2 MS2 spectrum of the ion at m/z 451. Peak 2 (B): B-1 MS spectrum of peak 2 ([M−H]−). Peak 3 (C): C-1 MS spectrum of peak 3 ([M−H]−), C-2 MS2 spectrum of the ion at m/z 613, C-3 MS3 spectrum of the ion at m/z 451. Peak 4 (D): D-1 MS spectrum of peak 4 ([M−H]−), D-2 MS2 spectrum of the ion at m/z 451
