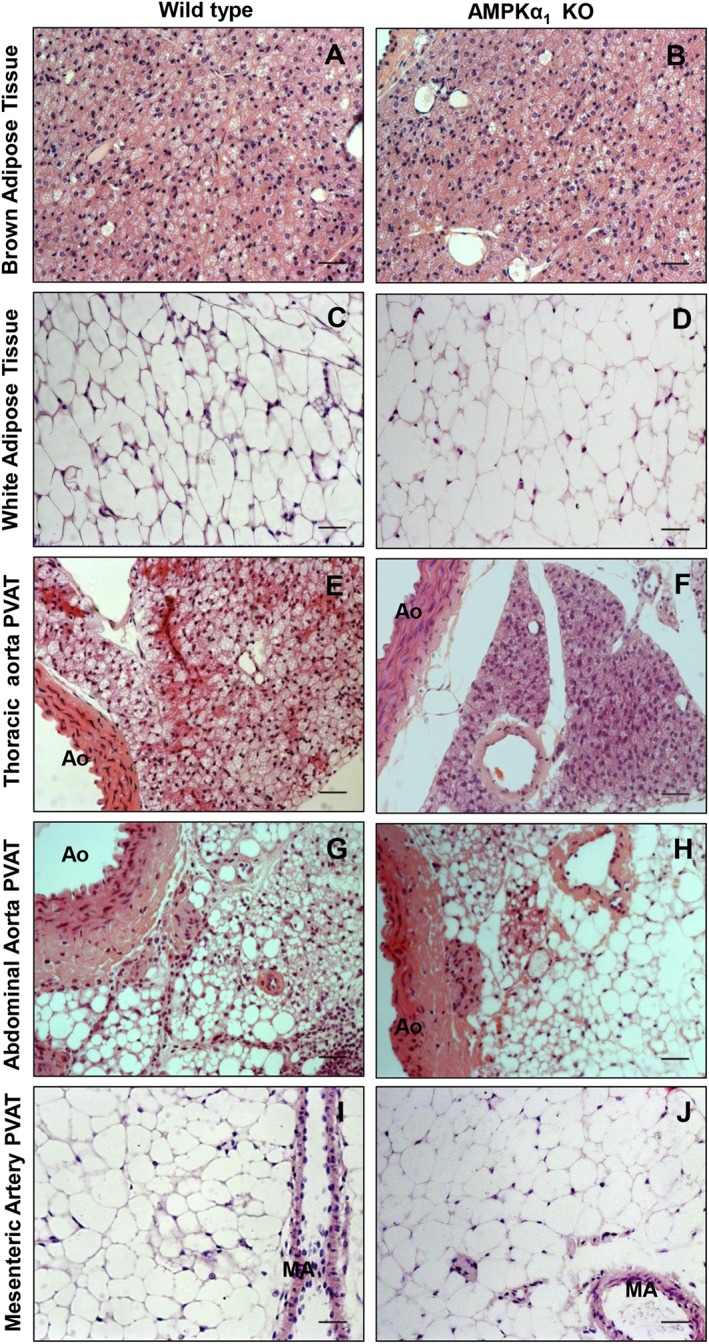
Figure 1.

Representative photomicrographs showing the morphology of fat depots in WT and AMPKα1 KO mice. (A and B) Subscapular BAT; (C and D) epididymal WAT; (E and F) thoracic PVAT; (G and H) abdominal PVAT; and (I and J) mesenteric PVAT. Aortic PVAT had the morphology of BAT. AO = aorta, MA = mesenteric artery, scale bar = 20 μm.
