
Figure 2.
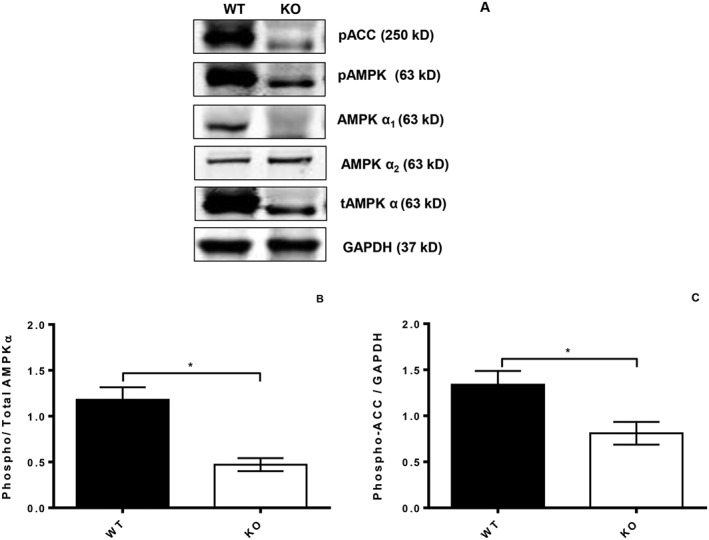
Western blots showing the expression of AMPKα isoforms and expression of the downstream kinase ACC in PVAT from WT (right lanes) and KO mice (left lanes). KO mouse PVAT showed a reduction in expression of AMPKα1 and total AMPKα with no change in AMPKα2. KO PVAT also had significantly reduced phosphoAMPK and ACC. *P < 0.05, KO compared to WT PVAT; n = 5.