Figure 3.

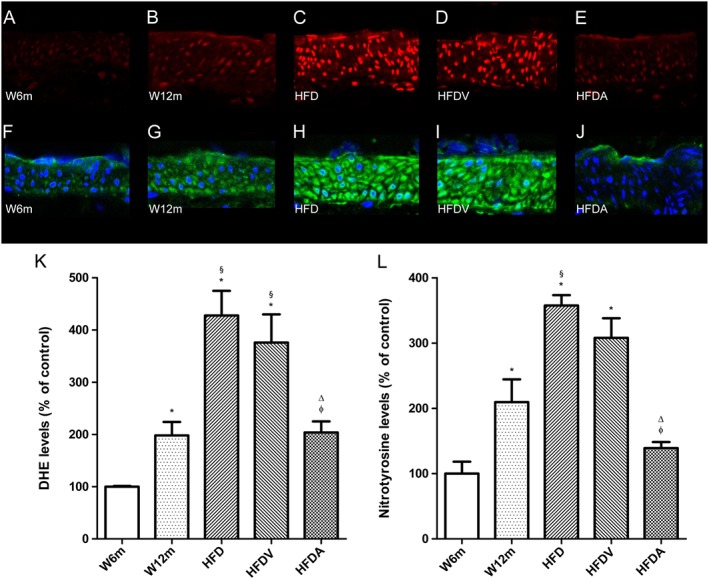
In situ detection of superoxide (A–E) and nitrotyrosine levels (F–J) in rat mesenteric arteries. Representative DHE‐stained mesenteric artery sections reflect production of superoxide (A–E) with the different treatments. The endothelium is facing up in all layers. At identical settings, fluorescence in sections from W12m rats (B) was increased compared those from W6m rats (A). Note the markedly increased fluorescence, reflecting superoxide levels in the endothelium, intima and media of HFD rats (HFD and HFDV; C and D respectively). Fluorescence decreased to basal levels (as in W6m rats) in the adiponectin (HFDA)‐treated group (E). Panel (K) shows quantification of the fluorescence ethidium signal in the different groups of arteries. Representative mesenteric sections showing nitrotyrosine staining (F–J), indicative of increased peroxynitrite formation, in W6m (F), W12m (G), HFD (H), HFDV (I) and HFD treated with adiponectin (HFDA; J) rats. Panel (L) contains quantification of the green fluorescence in the different groups of arteries. Data are mean ± SE (n = 11 animals per group). *P < 0.05, significantly different from W6m group; §P < 0.05, significantly different from W12m group; φ P < 0.05, significantly different from HFD group; ΔP < 0.05, HFDV group.
