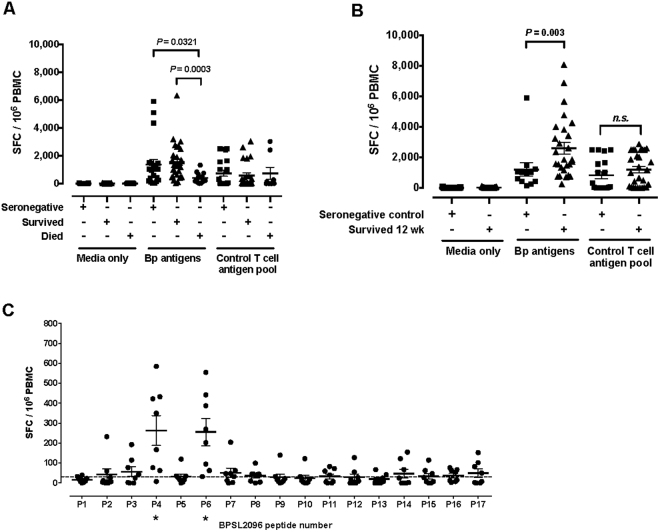
Figure 4.
Magnitude of T cell responses to Bp antigens in survivors and fatal cases compared to T cell immunity to Bp antigen BPSL2096 is concentrated on 2 peptide epitopes. IFNγ T cell responses to all 15 Bp proteins and to a control T cell antigen pool were summed for each individual in the seronegative control (black squares, n = 18) melioidosis survivor (black triangles, n = 30) and melioidosis fatality (black circles, n = 12) groups. Data are shown for both acute melioidosis (A) and at 12 weeks post acute illness (B). Error bars represent mean + SEM and statistical significance between groups was determined using the Mann Whitney test. IFNγ ELISpot assays were performed for a BPSL2096 20mer peptide panel. A positive response (*) was defined as 2 SD above the mean of the media only control and is represented by a dotted line. Error bars represent mean + SEM (C).

