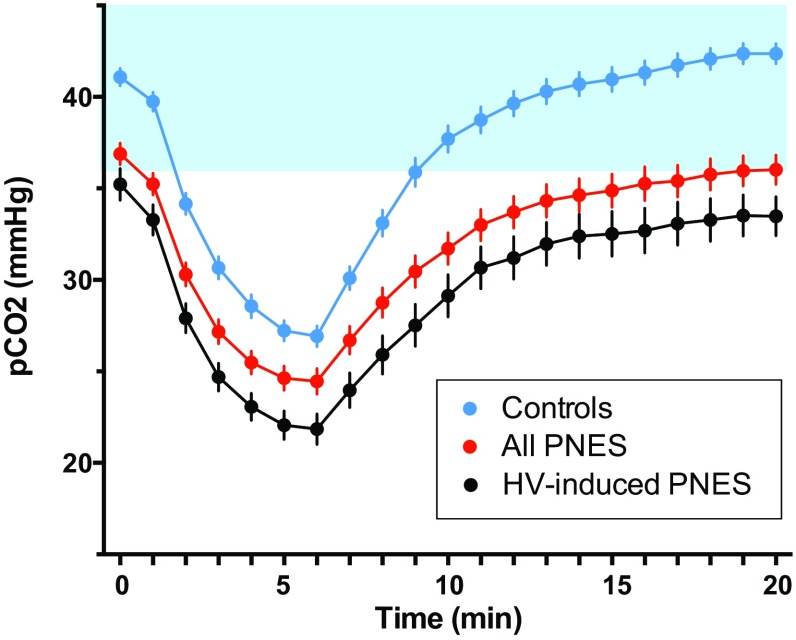
Fig. 1.
Hyperventilation profiles in children and adolescents assessed for PNES and in controls. The shaded blue area depicts the homeostatic range for arterial CO2. The top blue line depicts controls. Controls showed a clear pattern of PCO2 changes during the HV task: a baseline PCO2 within the homeostatic range, a steep drop in PCO2 during HV, and a prompt return to homeostasis during recovery. The middle red line depicts the 60 children and adolescents with PNES who participated in the study. Children and adolescents with PNES showed a downwardly skewed HV-challenge profile suggesting difficulties with PCO2 regulation. The bottom black line depicts the subgroup of 32 children and adolescents who whose PNES were typically preceded by—“triggered by”—HV

