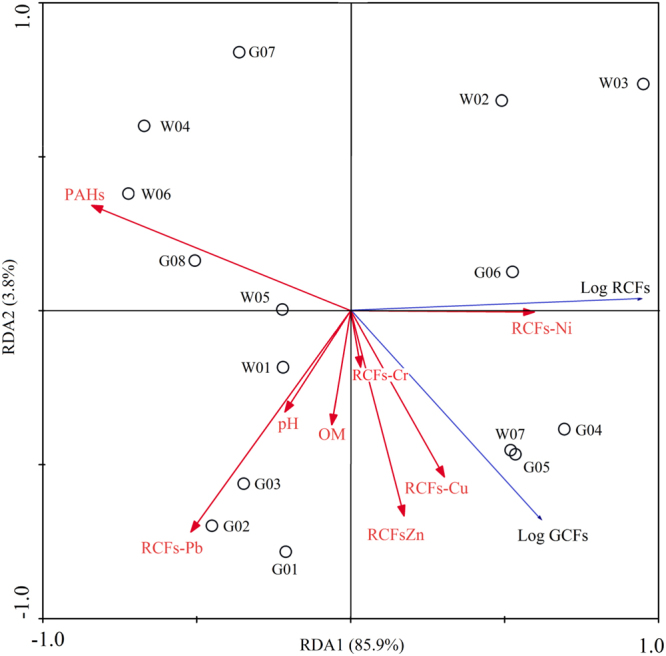
Figure 5.

Redundancy analysis (RDA) triplot summarizing variation in PAHs uptake by maize across the soil properties and heavy metal uptake. PAHs and RCFs-Pb are included as explanatory variables that account for 61% (p < 0.01) and 20% (p < 0.01) of the total variance. Circles represent soils at different sites; red and blue arrows illustrate maize uptake of PAHs and heavy metals, respectively. Eigenvalues for the first two environmental gradients are presented.
