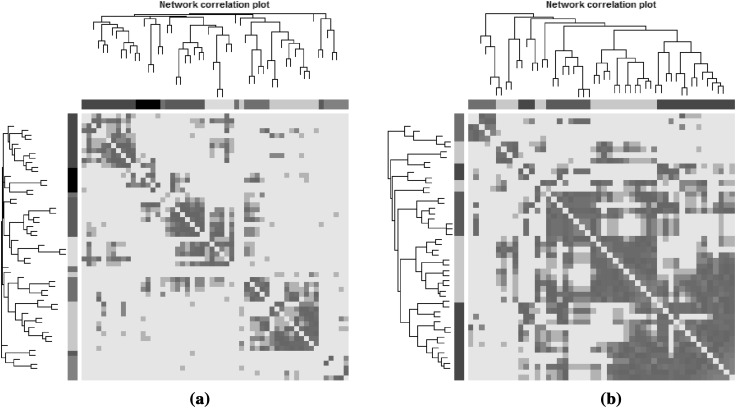
Fig. 2.
Heatmap plots for plant metabolites. Heatmaps were estimated for a when the original metabolite values were used, and b when using the metabolite information related to the Genotype. Deep red colors high values of absolute correlation between pairs of metabolites, while lighter colors correspond to weaker correlations. Dendrograms were obtained using hierarchical clustering while modules correspond to square blocks along the diagonal. Interconnected modules are color coded by using the color bands beneath the displayed dendrograms

