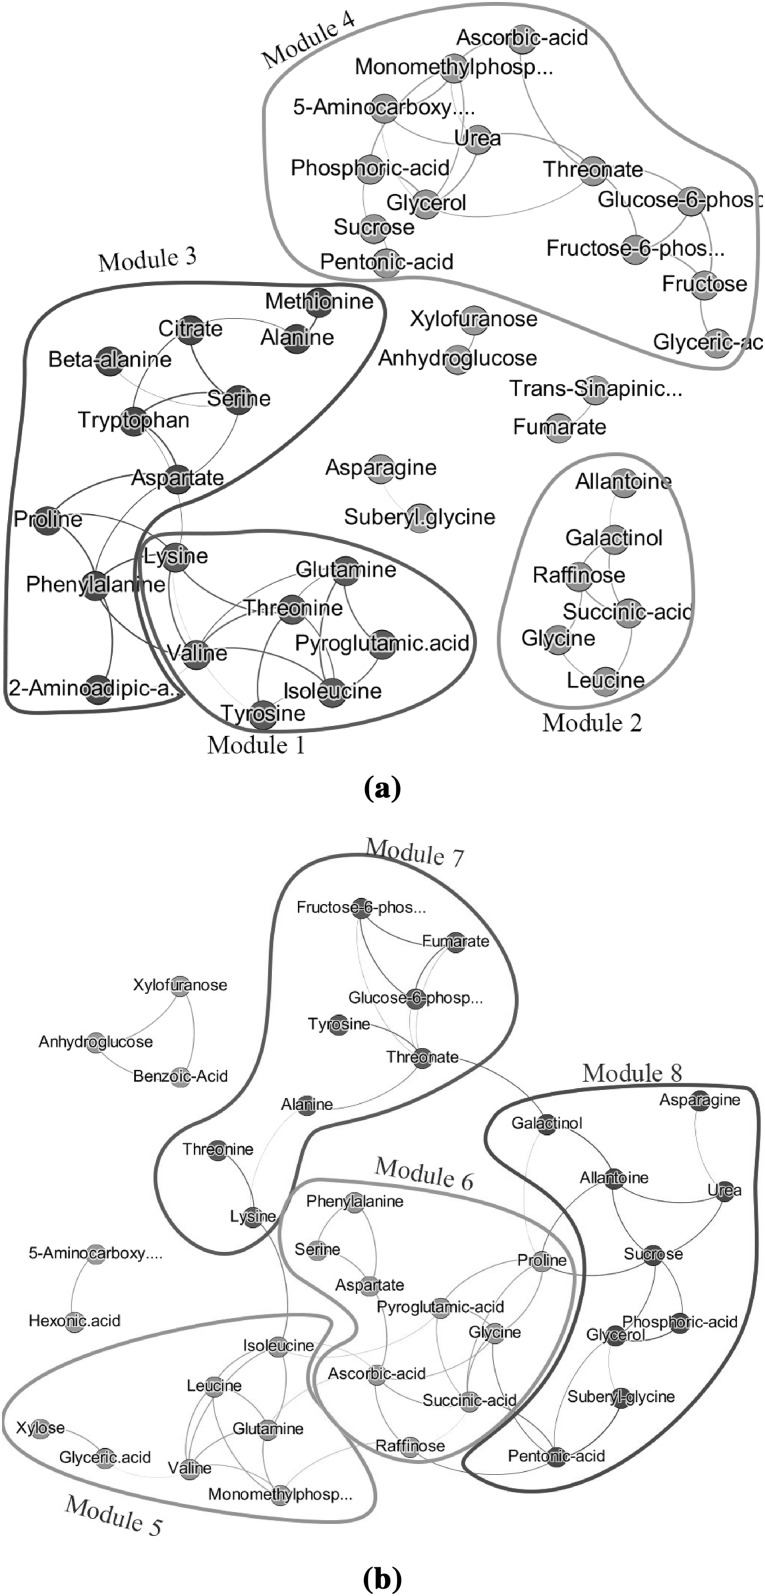
Fig. 4.
Estimated metabolite networks for plant data based on GL. In a, the estimated network is based on the original metabolite values, whereas in b Genotype related metabolite values have been used. Different modules have been color coded by the colors pinpointed in column ”Color Coded” of Table 3. The colors selection was guided by the two-step dynamic hybrid algorithm implemented in the R-package WGCNA

