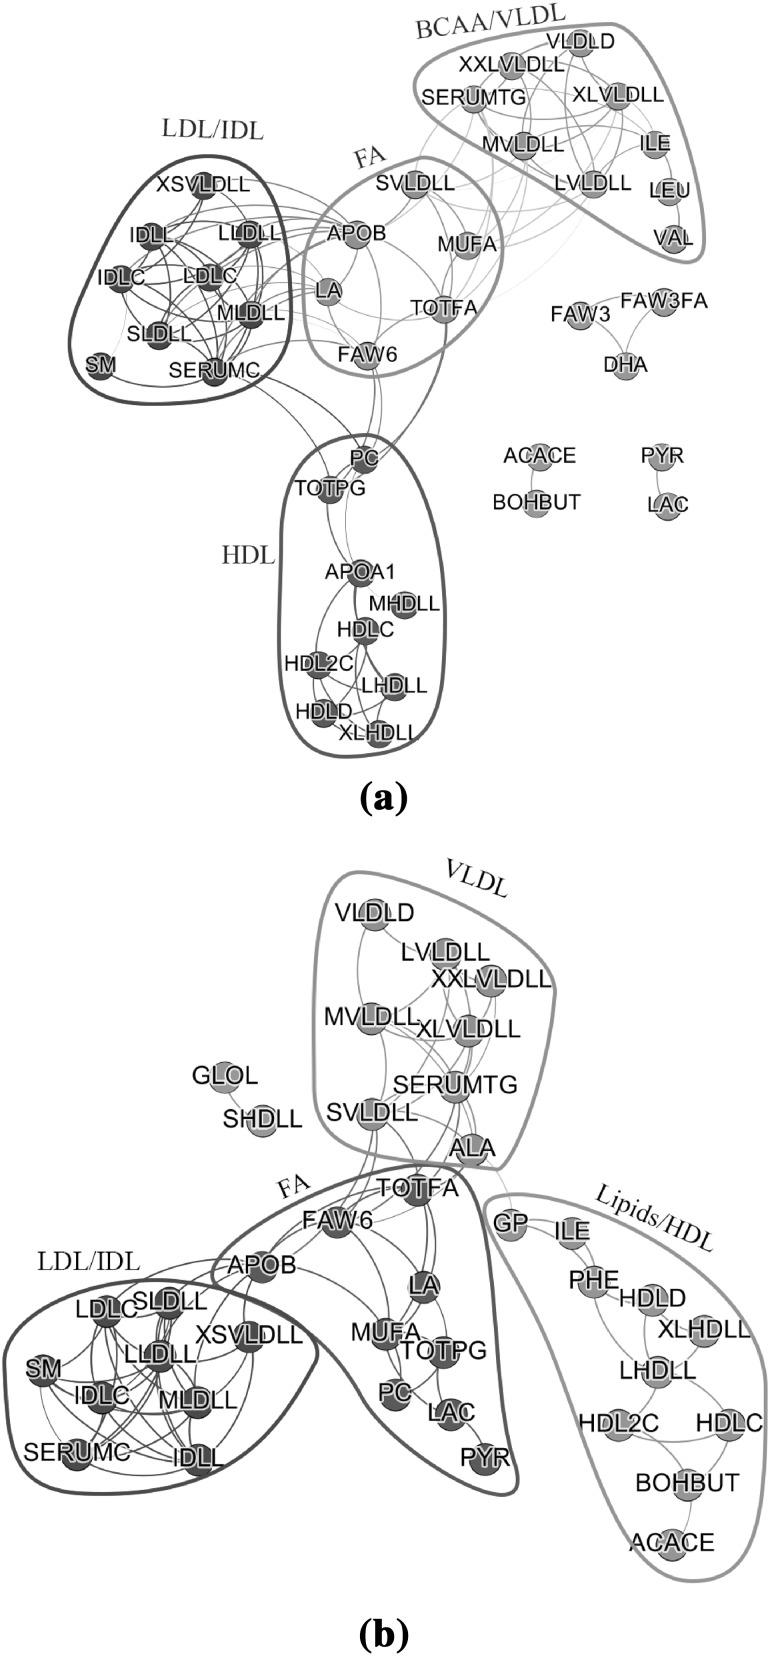
Fig. 7.
Sparse metabolite networks estimated by GL. The networks were constructed a using the original metabolite values, and b using the metabolite values driven by variation originating from BMI. Metabolites were colored based on the module they belong to. Information on the membership of each metabolite and on the color they have been colored can be found in Table 6

