Figure 1.
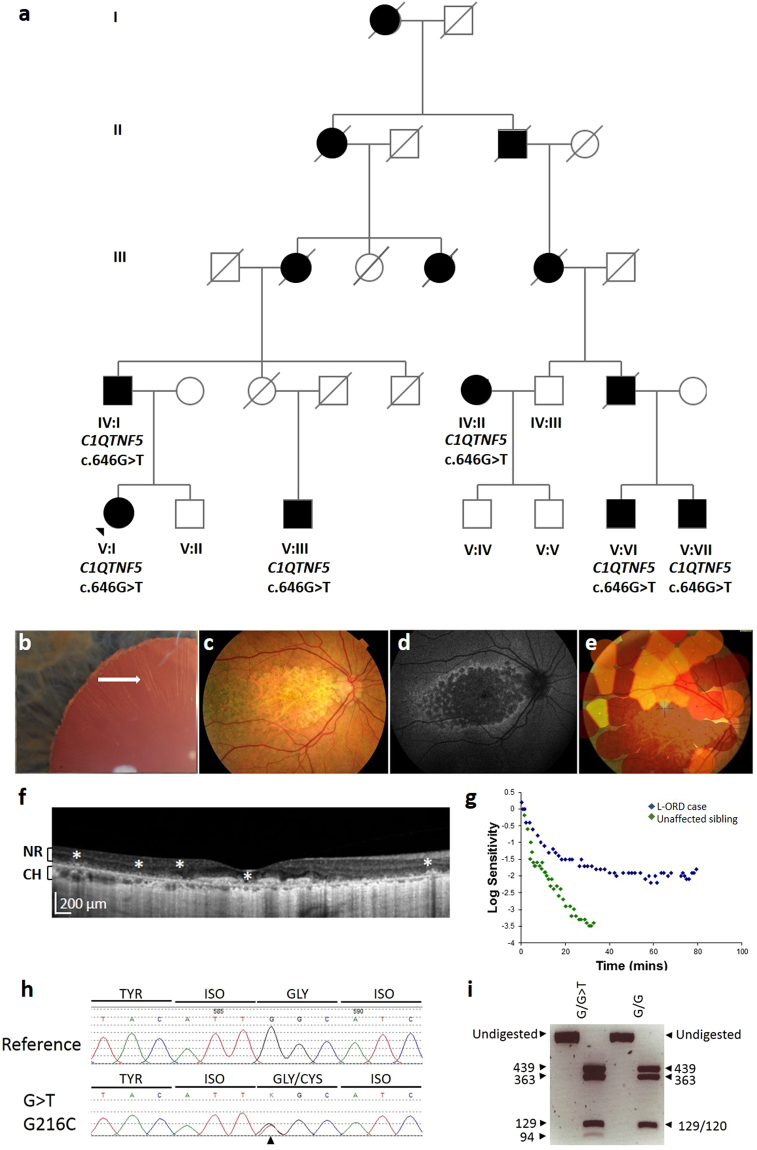
Pedigree, genotype and phenotype of family 1. (a) L-ORD family 1 is a multi-generation pedigree showing autosomal dominant inheritance. Squares represent males, circles represent females. Shaded shapes indicate an affected individual. Clinical phenotyping of the proband V:I. (b) Anterior segment slit lamp photograph shows long-anterior zonules (white arrow) encroaching beyond the pupil margin in a dilated pupil. (c) Colour fundus photography shows areas of central atrophy affecting the macula and (d) Fundus autofluorescence imaging shows areas of central scalloped hypoautofluorescence matching the areas of atrophy surrounded by a cuff of increased autofluorescence. (e) Microperimetry interpolated plot superimposes areas of retinal sensitivity on a colour fundus image. Areas of good sensitvity vary from green to yellow to red for poor sensitivity. Areas with no sensitivity have no polygons. The image shows non-detectable sensitivity at the macula for the patient. (f) Hyperreflective deposits deep to the neural retina, indicated by asterisks, are observed in the macula in an OCT scan of the proband. NR, neural retina; CH, choroid. (g) Dark adaptometry of the proband (L-ORD case) shows that recovery of sensitivity after light exposure is slow and final sensitivity is still reduced at 80 minutes, compared to the normal, rapid recovery of sensitivity in an unaffected sibling. (h) Sequence analysis of C1QTNF5 exon 3 revealed a heterozygous c.646G > T transversion, resulting in a glycine to cysteine mutation at position 216 in the L-ORD case (lower panel) compared to an unaffected relative (upper panel). (i) HpyCh4V restriction digest confirms the c.646 G > T mutation by generating fragments of 439, 363, 129 and 120 bp in homozygous G (p.G216) samples, and 439, 363, 129, 94 and 26 bp for the mutant G > T (p.C216) allele.

