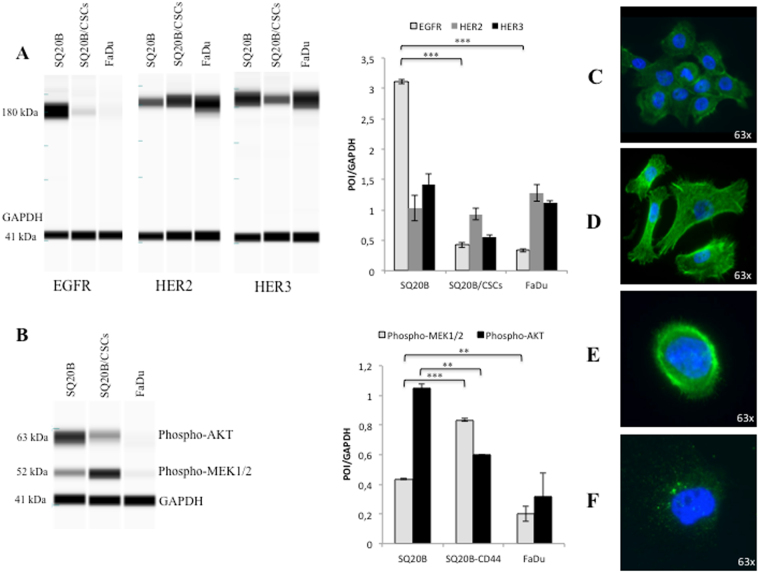
Figure 1.
Basal characteristics of SQ20B cells, SQ20B-CSCs and FaDu cells. (A) EGFR (180 kDa), HER2 (184 kDa) and HER3 (189 kDa) basal expression in SQ20B cells, SQ20B-CSCs and FaDu cells. Protein expression was analysed with WES™ (a simple western blotting technique using an automated capillary-based size sorting system) and expressed graphically as the GAPDH ratio. (B) Phospho-AKT (Ser473) (63 kDa) and phospho-MEK1/2 (Ser217/221) (52 kDa) basal expression in SQ20B cells, SQ20B-CSCs and FaDu cells. Protein expression was analysed with WES™, and expressed graphically as the GAPDH ratio (protein-of-interest (POI)/GAPDH). (C) Microscopic observation (63×) of SQ20B cells stained with phalloidin (green actin) and DAPI (blue nucleus). (D) Microscopic observation (63×) of SQ20B-CSCs stained with phalloidin (green actin) and DAPI (blue nucleus). (E) Microscopic observation (63×) of a SQ20B cell stained with phospho-EGFR-FITC (green) and DAPI (blue nucleus). (F) Microscopic observation (63×) of a SQ20B-CSC stained with phospho-EGFR-FITC (green vacuoles) and DAPI (blue nucleus). Statistically significant differences are expressed as *p < 0.05, **p < 0.01 and ***p < 0.001. Each experiment was performed in triplicate.

