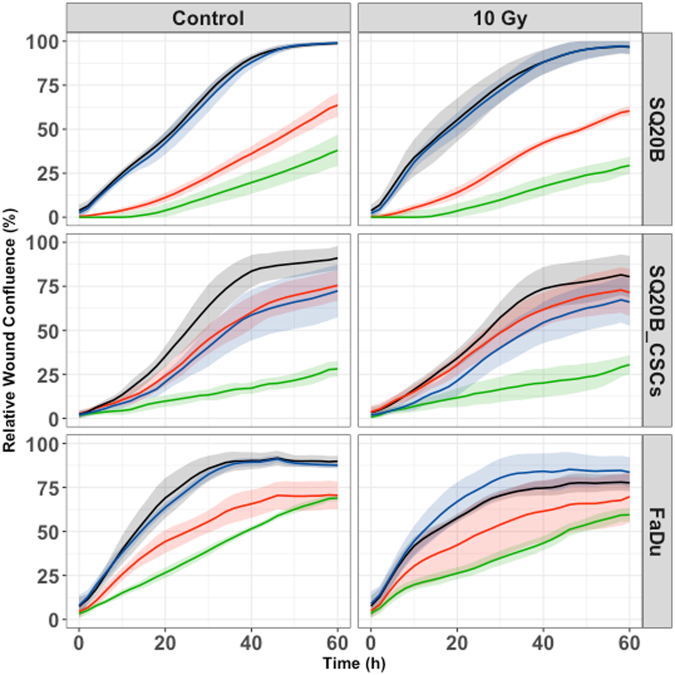
Figure 3.
Cell migration under each treatment condition, graphically represented by the mean migration curves +/− standard deviation. Blue curve, control; black curve, pertuzumab 20 μg/mL; red curve, cetuximab 5 nM; green curve, cetuximab 5 nM + pertuzumab 20 μg/mL. Cell migration was measured by an IncuCyte Zoom scratch wound analyser for each cell line under the following treatment conditions: control; cetuximab 5 nM; pertuzumab 20 μg/mL; cetuximab 5 nM + pertuzumab 20 μg/mL; 10 Gy; 10 Gy + cetuximab 5 nM; 10 Gy + pertuzumab 20 μg/mL; 10 Gy + cetuximab 5 nM + pertuzumab 20 μg/mL. Each experiment was performed in triplicate.

