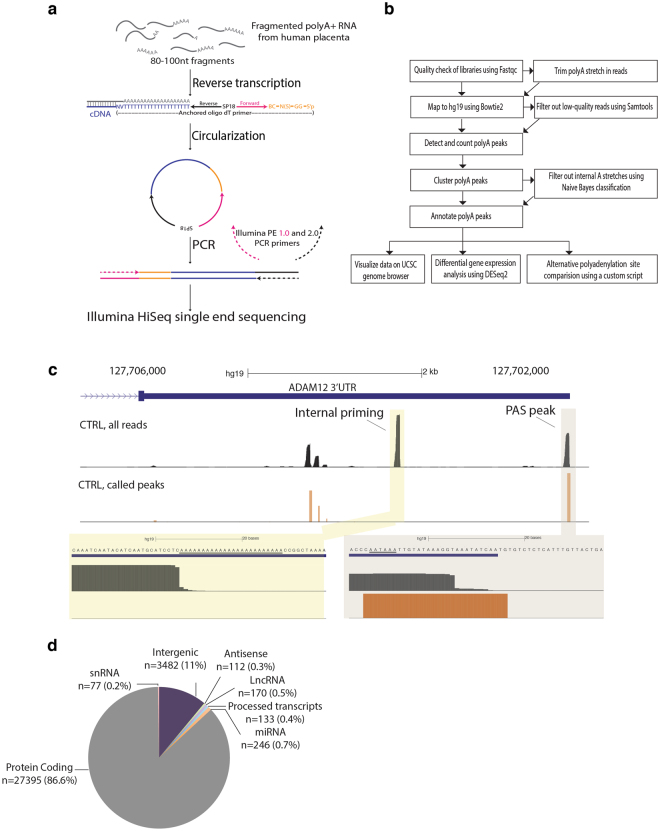
Figure 2.
PAS-Seq library and bioinformatics workflow. (a) Schematic overview of PAS-Seq library preparation workflow. (b). PAS-Seq bioinformatics pipeline schematic. (c) Representative view of read alignment locations (top track) and called PAS peaks (bottom track) on the ADAM12 3′-UTR. Our algorithm is able to remove background noise, filter out internal priming sites and accurately identify true polyadenylation sites. (d) Distribution of PAS peaks among named gene classes and intergenic regions.

