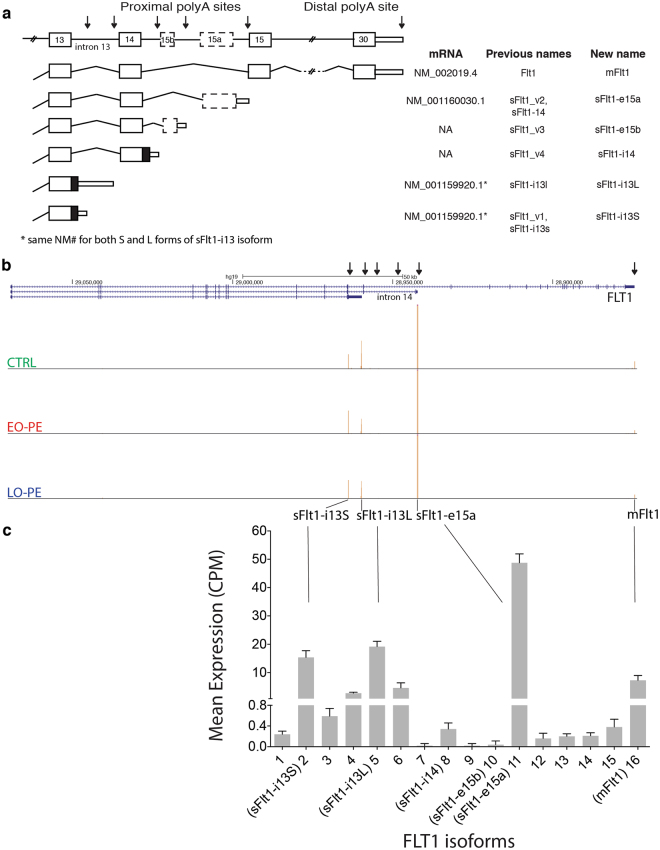
Figure 4.
FLT1 alternative PAS isoform analysis. (a) Schematic of FLT1 gene and six previously identified mRNA isoforms arising from alternative polyadenylation. Thick boxes: protein coding exons; thin boxes: 3′-UTRs; lines: introns; arrows: sFlt1 and mFlt1 polyadenylation sites. Table shows all previous isoform names and new systematic names. (b) UCSC genome browser view showing PAS-Seq peak distribution on the FLT1 gene for a representative CTRL (top track), EO-PE (middle-track) or LO-PE (bottom track) patient. Arrows: sFlt1 and mFlt1 polyadenylation sites for isoforms in (a). (c) Bar graph showing mean expression (counts per million; CPM) across all libraries for all 16 detected mRNA isoforms at the FLT1 locus.

