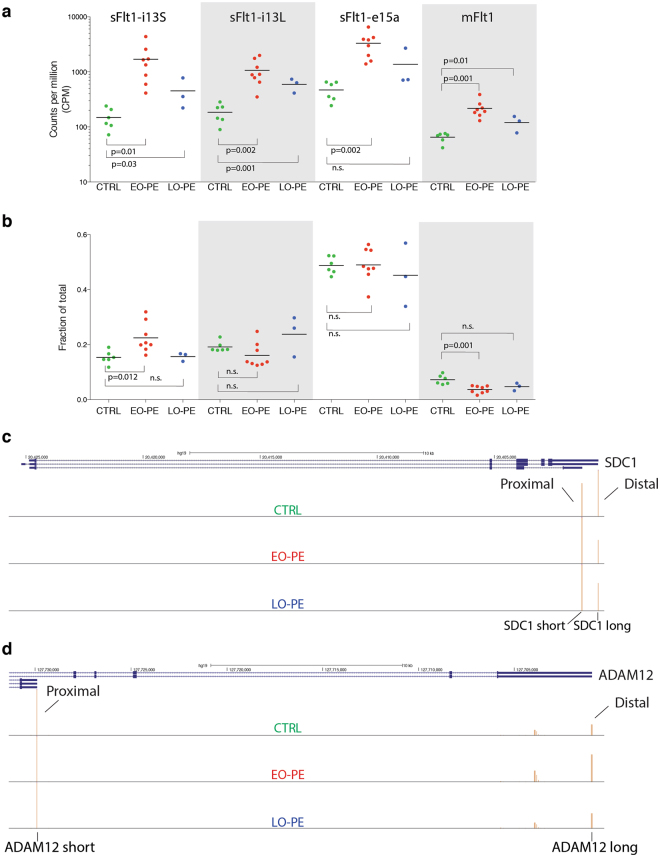
Figure 5.
Differential PAS isoform analysis on FLT1, SDC1 and ADAM12 genes. (a) Superimposed scatter plots showing expression (counts per million mapped reads; CPM) of the four most abundant FLT1 mRNA isoforms. (b) Superimposed scatter plot comparing fractions of total PAS reads mapping to the FLT1 locus represented by each indicated mRNA isoform. For a. and b., each point represents an individual CTRL, EO-PE or LO-PE patient with the color indicating patient type as described in Fig. 1c. A two-way t-test was used for statistical comparisons between indicated groups. Horizontal line: mean; n.s.: not statistically significant. (c) UCSC genome browser view of SDC1 gene illustrating differential PAS isoform abundance (Distal-to-Proximal Switch) for a representative CTRL (top track), EO-PE (middle-track) or LO-PE (bottom track) patient. (d) Same as c, but ADAM12 gene (Proximal-to-Distal Switch).

