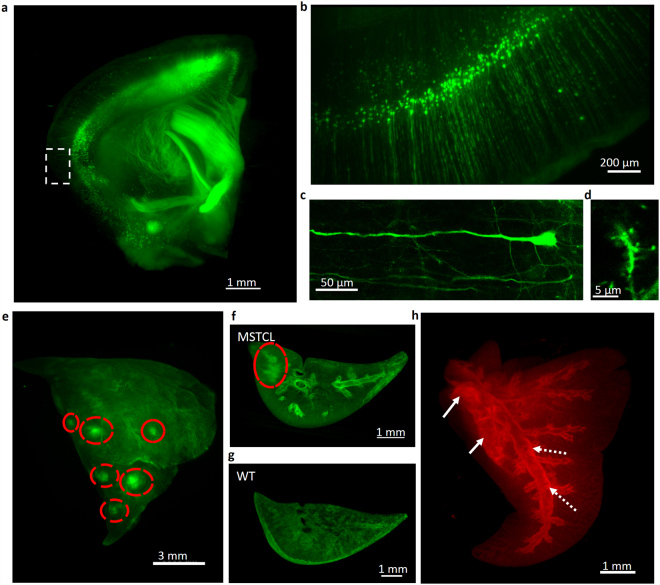
Figure 4.
Rapid and high-performance 3D volume imaging of various samples clarified by UbasM. (a) A 3D reconstruction fluorescent image of thy1-YFP (H-line) mouse brain slice (10-week-old female) acquired with OPT. Magnified view of the boxed in (a) is shown in (b) acquired with OpenSPIM. After UbasM clearing, high-magnification imaging of fine structures about a single neuron (c) and dendritic spines (d) with confocal microscopy. 3D reconstruction fluorescent images of (e) a mouse half-lung sample and (f) a tip of lung sample showing metastases of murine breast cancer cell line 4T1-ZsGreen1 from foot pad locations acquired with OPT (red circles indicate the clusters of metastasized cells). (g) 3D reconstruction fluorescent images of a tip of the control lung sample (from wild type mouse) showing the autofluorescent structures as comparison. (h) 3D reconstruction images of fluorescent metastatic cancer cells (i.e. melanoma cell line B16F10-tdTomato from subcutaneous locations) within a mouse lung sample acquired with OPT. The comparison of cancer model and the wild type is shown in Supplementary Fig. 7. It is noted that there is bright fluorescence of metastatic cancer cells within the bronchi that may indicate the paths of cancer cells spreading through the lymphatic or vascular circulation (indicated by white dash arrows). The bright fluorescent areas (indicated by white solid arrows) show where the malignancy has infiltrated the lung tissue. (a,b), (e–h) are maximum intensity projections while (c,d) are confocal section images. WT – wild type; MSTCL - metastatic spread of tumor cell line. Scale bars represent 1 mm (a), 200 µm (b), 50 µm (c), 5 µm (d), 3 mm (e), 1 mm (f,g,h).

