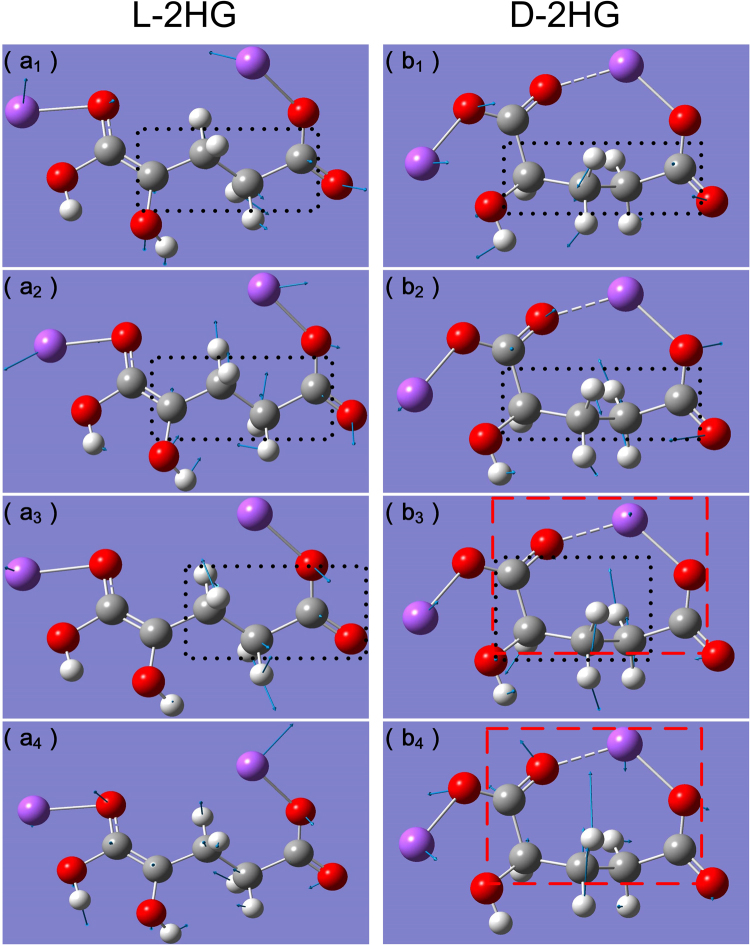
Figure 3.
Vibration modes of absorption peaks of (a 1 –a 4) L-2HG and (b 1 –b 4) D-2HG. (a 1) 0.769 THz (a 2) 1.337 THz (a 3) 1.456 THz (a 4) 1.933 THz, (b 1) 0.760 THz (b 2) 1.200 THz (b 3) 1.695 THz (b 2) 2.217 THz. White, gray, red, and purple atoms represent H, C, O, Na atoms, respectively. Blue arrows indicate the vibrational direction of atom. Black dotted boxes refer to the dominant functional groups in the vibration modes. Red dashed boxes indicate the entire molecular vibrational ring.

