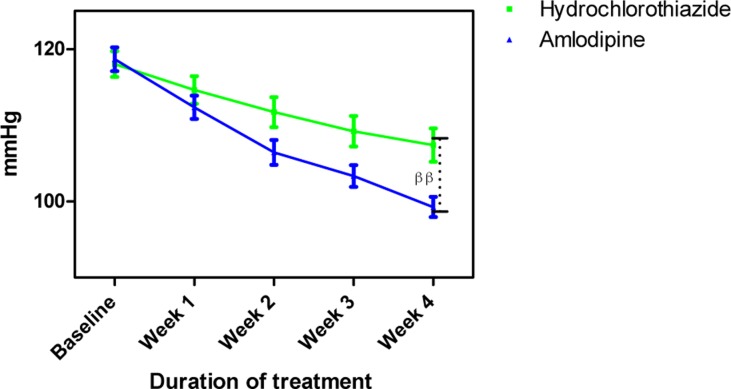
Figure 3.
Mean arterial blood pressure measurements following treatment with amlodipine and hydrochlorothiazide
Each point on the graph represents the average of at least 25 independent measurements. Error bars are standard error of the mean (SEM); ββP < 0.01 (hydrochlorothiazide versus amlodipine; two-way ANOVA with Bonferroni post-test, using Graphpad Prism 5.0).

