Figure 3.

Segmentation process
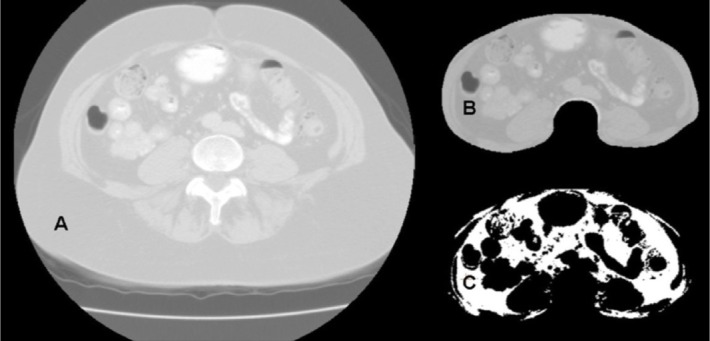
A = Raw (2D) image; B = Cropped area to exclude subcutaneous fat; C = Segmentation of fat with bounds of −190 to −30 Hounsfield units.

Segmentation process
A = Raw (2D) image; B = Cropped area to exclude subcutaneous fat; C = Segmentation of fat with bounds of −190 to −30 Hounsfield units.