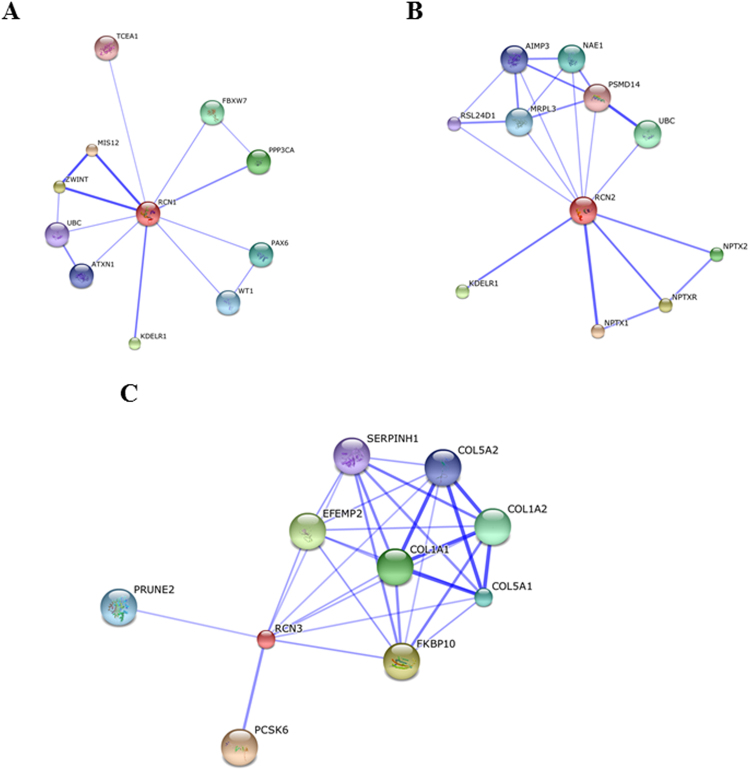
Figure 2.
Protein interactome network for RCN proteins. Functional interactors of RCN-1 (A), RCN-2 (B), and RCN-3 (C) extracted from STRING tool. This database includes interactions from published literature describing experimentally studied interactions, as well as those from genome analysis using several well-established methods based on domain fusion, phylogenetic profiling and gene neighbourhood concepts. Accordingly, a confidence score for every protein–protein association is assigned to the network. A higher score is assigned when an association is supported by several types of evidence. To minimize false positives as well as false negatives, all interactions tagged as “low-confidence” (<0.150) in STRING database were eliminated from this study. Proteins are represented with nodes and the interactions with continuous lines represent direct interactions. Stronger associations are represented by thicker lines.

