Figure 5.
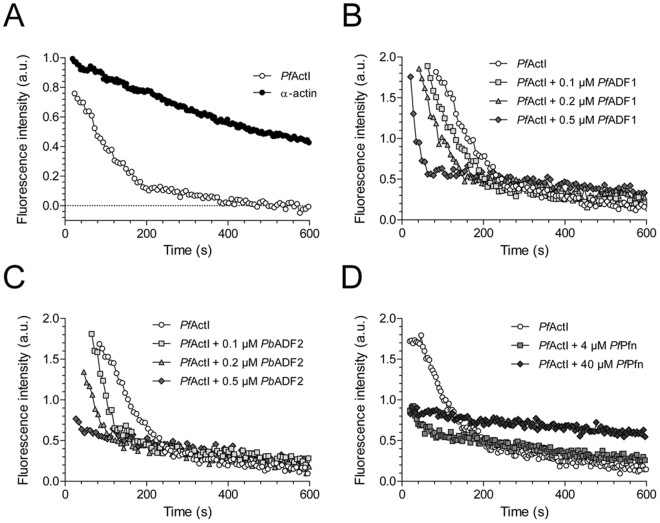
Dilution-induced depolymerization curves of PfActI. (A) Comparison of PfActI and α-actin, depolymerized by dilution from 5 µM to 50 nM. Half-times of depolymerization were 74 ± 4.3 s for PfActI (n = 3) and 376 ± 71 s for α-actin (n = 2). Values represent mean ± standard deviation. The rates are normalized based on a single-phase exponential decay fit of the data. (B) PfActI depolymerized in the presence of three concentrations of PfADF1 in the diluting buffer. For clarity, curves are moved to the right in increments of 20 s, leaving the curve with 0.5 µM PfADF1 at its initial place. (C) PfActI depolymerization as in (B), but supplemented with PbADF2 instead of PfADF1. (D) PfActI depolymerization in the presence of high concentrations of PfPfn in the dilution buffer. (a.u. = arbitrary units).

