Figure 1.
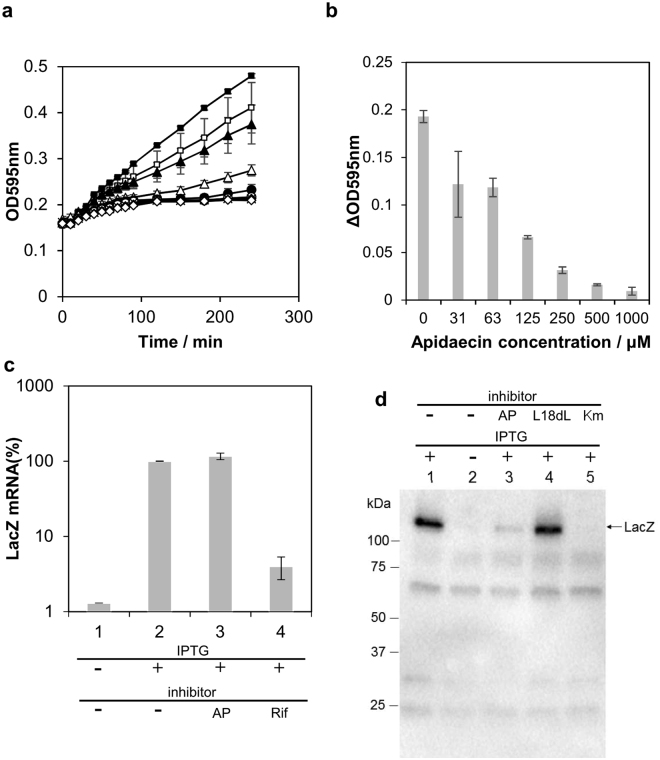
Apidaecin treatment of E. coli and its effects on lacZ expression. (a) Growth curve with different concentrations of apidaecin (black square: 0 μM, white square: 7.5 μM, black triangle: 15 μM, white triangle: 30 μM, black circle: 63 μM, white circle: 125 μM, cross: 250 μM, black diamond: 500 μM, white diamond: 1000 μM), (b) Assay of lacZ expression with increasing concentrations of apidaecin. E. coli was treated with apidaecin for 1 h, after which IPTG was added to induce lacZ expression. ΔOD595 was defined as the difference between optical density (OD) with and without X-gal. (c) Quantification of lacZ mRNA expression by quantitative real-time PCR. 1: untreated, 2: addition of 0.1 mM IPTG, 3: treatment with 500 μM apidaecin and 0.1 mM IPTG, and 4: treatment with 25 μM rifampicin and 0.1 mM IPTG. The expression level was defined as relative to the value in treatment No. 2. (d) Immunoblot analysis of native LacZ. Lane 1: addition of 0.1 mM IPTG, lane 2: untreated, lane 3: 500 μM apidaecin and 0.1 mM IPTG, lane 4: 500 μM L18dL apidaecin and 0.1 mM IPTG, and lane 5: 100 μM kanamycin and 0.1 mM IPTG. Data are expressed as the mean ± standard deviation of three trials (A, B, and C).

