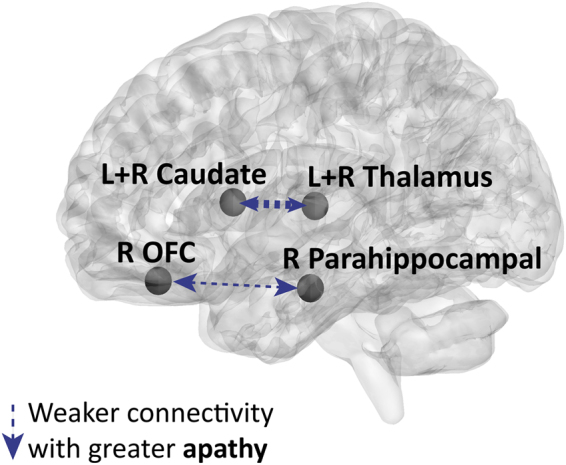
Figure 4.

Illustration of functional connections predicted by apathy in PD patients. Functional connections predicted by apathy while controlling for other neuropsychiatric scales and UPDRS-III are indicated by arrows on a 3D brain template. The significant associations were all negative. The width of the arrows represents the number of functional connections between the regions (see Supplementary Table S2 for the full list of connections). Abbreviations: OFC, orbitofrontal cortex; Parahippocampal, parahippocampal gyrus; L, left; R, right. P < 0.05, FDR corrected for multiple comparisons.
