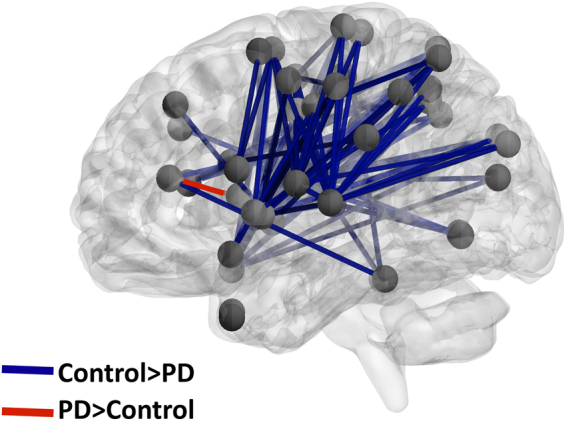
Figure 5.

Differences between PD patients and healthy controls in whole-brain functional connectivity. Stronger functional connections in healthy controls are indicated by blue lines and stronger functional connections in PD patients are indicated by red lines (see Supplementary Table S3 for the full list of connections). PD patients showed an extensive reduction in functional connectivity mainly in the sensorimotor, temporal, parietal and subcortical regions. Only the right caudate-right anterior cingulate functional connection was stronger in PD patients (1 out of 122 significant connections). These group-differences were accounted for by either the neuropsychiatric symptoms or the motor deficits of PD patients. Differences between PD patients and healthy controls were evaluated using two sample two-tailed t tests with a statistical threshold of P < 0.05, FDR corrected for multiple comparisons.
