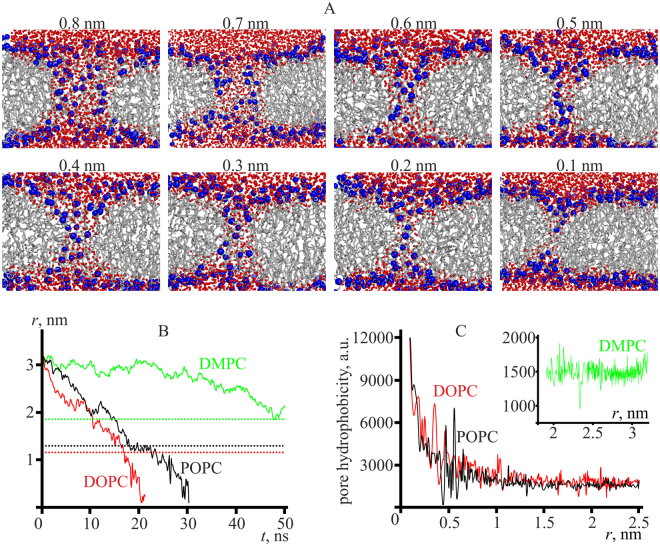
Figure 2.
(A) Snapshots of POPC membrane (sideview) of a spontaneously closing pore obtained from molecular dynamics. Blue spheres represent polar atoms (phosphorus and nitrogen), red spheres represent water molecules. Lipid tails are shown as grey lines. Pore radius determined as described in the “Materials and Methods” Section is specified above every snapshot. (B) Time course of the pore radius in the molecular dynamics simulations of spontaneous pore closure. Red curve — DOPC membrane; black curve — POPC membrane, green curve — DMPC membrane. Dotted lines correspond to equilibrium pore radii, calculated in the framework of continuum theory. (C) Dependence of the hydrophobicity of the pore boundary on the pore lumen radius obtained in molecular dynamics simulations. Red curve — DOPC membrane; black curve — POPC membrane; inset, green curve — DMPC membrane. Each curve was averaged over two independent simulations.

