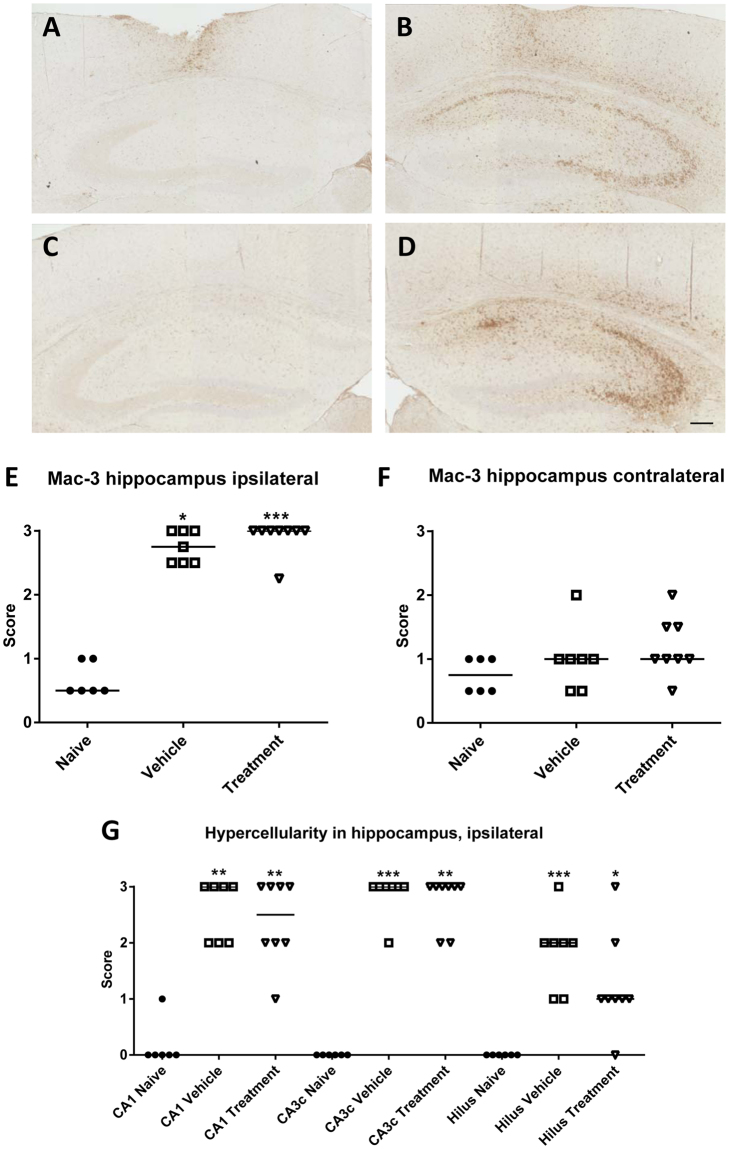
Figure 8.
Analysis of Mac-3 positive cells and hypercellularity in the hippocampus at one week following intrahippocampal kainate injection. (A–D) Representative photomicrographs showing Mac-3-labeled activated macrophages/microglia at a section level of −1.7 mm from bregma. Serial sections containing the ipsilateral dorsal hippocampus were stained with antibody against Mac-3 in order to label activated macrophages/microglia and scored semi-quantitatively within the hippocampus (see Methods). “A” shows the contralateral and “B” the ipsilateral hippocampus of a vehicle-treated mouse. “C” shows the contralateral and “D” the ipsilateral hippocampus of a NBQX-ifenprodil-treated mouse. Scale bar in “D” indicates 200 µm. Note that Mac-3 staining mainly occurs in the ipsilateral hippocampus, particularly the CA1 and CA3 sectors, and is not affected by treatment with NBQX and ifenprodil. “E” and “F” show semiquantitative analyses of Mac-3-positive cells within the ipsilateral (E) and contralateral (F) hippocampus. “G” illustrates hypercellularity in different subfields of the ipsilateral hippocampus. In E–F, individual data are shown; the group median is indicated by the horizontal line. Significant differences to naive controls are indicated by asterisk (*P < 0.05; **P < 0.01; ***P < 0.001).

