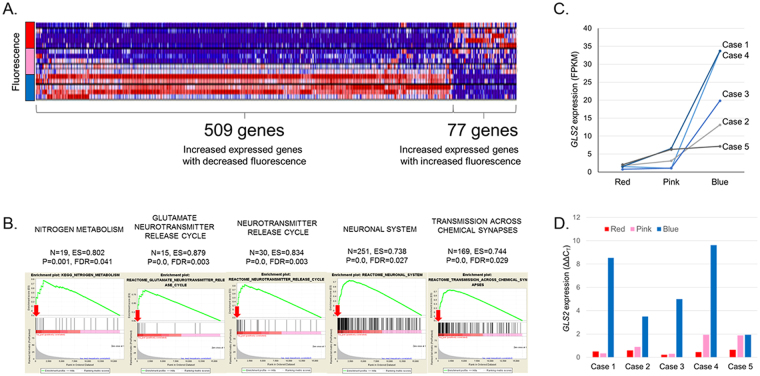
Figure 2.
Identification of key genes associated with 5-aminolevulinic acid (5-ALA) fluorescence intensity in glioblastoma. (A) Results of RNA-sequencing of classified samples, which were analyzed according to differential expression along with the fluorescence intensity (fold change >2, p < 0.05, FDR < 0.01). Seventy-seven genes with positive correlation and 509 genes with negative correlation between the expression level and fluorescence intensity were identified. (B) Pathway analysis using gene set enrichment analysis (GSEA) resulted in 30 significantly enriched gene sets of (p < 0.01, FDR < 0.25). Among them, GLS2 (red arrows) was repeatedly found with a high enrichment score in the selected gene sets of metabolism and the neuronal system. (C) From the results of the RNA-seq FPKM values, GLS2 was highly expressed in areas of no fluorescence intensity, and the expression was decreased in areas of positive fluorescence in all samples. (D) The expression level of GLS2 in all samples, as measured by quantitative real-time PCR, confirmed the result of RNA-seq.

